Surface Temperature Record
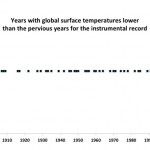
Just a quick item on the pause in global warming that is said to have happened over the last X number of years. I took NOAA's instrumental record since the late 19th century and calculated the average deviation for "surface" temperatures from a baseline for the entire period. Surface temperatures refer to the lower part of the atmosphere and sea surfaces. When you look at a graph of "global warming" expressed in temperatures, this is almost always what is meant (this leaves out a lot of things, including the poles, much of Africa, and deeper ocean waters). But it is a standard and a fairly…
It's been over two years since John V, used the surfacestations.org data to show that the warming trends were the same for "good" and "bad" weather stations. Since then they've collected data on more stations, but still have not published their own comparison. It would be cynical of me to suggest that the reason is that the data doesn't show what they want, but now Menne et al have published a peer reviewed paper analysing a more extensive set of stations, and surprise, surprise the "bad" stations have a cooling bias. John Cook has the details.