
[Update: see comments. We're having some dispute about whether to bet on the monthly averages (the scientifically respectable thing to do) or daily min (the wildly exciting popular choice). I need to bother work out the numbers. Until then, you'll have to be patient (2011/3/31; I've adjusted the posting date from 2011-03-22 to push this to the head of the queue)]
But not very different. Neven reminds me, again, that I promised to put up a slightly longer-term bet; see This year's sea ice and in particular this comment and reply.
Neven offers:
I'd be willing to bet 50 euros on a record low within the next three melting seasons. And with record low I mean absolute daily minimum extent based on data as reported by IJIS.
Well, we need not worry about the amount for the moment, instead I'm trying to set the terms of the bet (for amounts, it will be word-of-honour for anything down at the "trivial" end and something a little more formal if you want to go above £1,000).
I dislike daily values; monthly means are better, and are less likely to be influenced by oddities, and more likely to be consistent between series. I'm happy to use IJIS though.
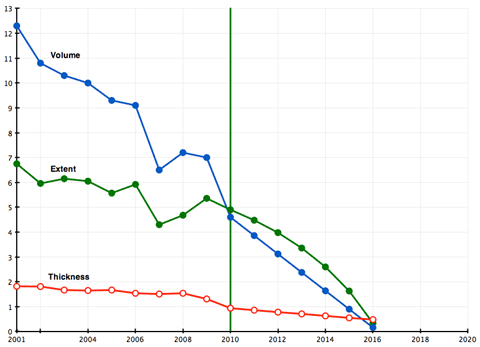 Otherwhere, Gareth predicts the end of summer sea ice in 5 years, based on extrapolating thickness trends, and I've taken the liberty of ripping off his image. This I don't believe at all, and if anyone is prepared to bet on no (or essentially no) summer ice by 2016, I'll be very interested.
Anyway, here is the pic I'm basing my judgement on:
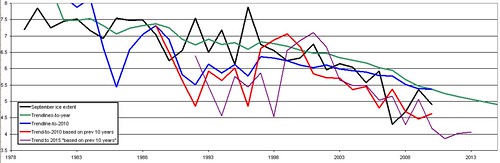
(this is a mod of one from a previous post). Black line is just the obs. Green line is trendline using all the data that far (so it is a straight line into the future). The other lines are a bit more complicated, and I keep forgetting what they are: the blue line is the trend, using data only as far as the point on the x-axis, but taking the trend to where it would be in 2010. The red line is the same as the blue, but using only the 10 years before that point. And lastly the one that matters is the purple line, which is the trend to 2013, again using the previous 10 years, though displaced off (so the point at 2013 is drawn from 2001-2010 data; the point at 2012 from 2000-2009, etc).
Using last-10-years is being pessimistic (or from my point of view, erring on the safe side) but based on that, the chance of something beating 2007 and setting a new record low within the next 3 years (including 2011) seems quite good. So I'm not betting on that; after all, remember that what we're aiming for is a bet that both sides regard as a sure-fire win for them :-). So, based on those lines, and needing the usual error margin of 0.5, which I'll multiply by sqrt(3) since there are 3 years, I think a "fair" (ish) bet would be on the ice going below 3 (whatever the units are, I forget) any time during the next 3 years. Anyone interested, or care to dispute my numbers?
Days vs Months
[Added in update, 2011/3/24 22:00]
Clearly, people would rather be betting on a record *daily* low, whereas I'd rather think in terms of monthly averages. My justification for that is that it reduces the statistical noise, and so allows for smaller uncertainty margins. Though I admit I haven't looked at the day/month differences. I suspect that really it shouldn't matter too much: ice can't vary much on a daily basis; it isn't possible to have some vast down-spike on just one day (barring an unlikely compression event). Conversely, if you believe in a record daily low, then you ought to believe in a record monthly low, too.
Refs
* IJIS / JAXA ice extent which DA notes (prematurely, but probably correctly) has just peaked this year.
If using IJIS data with daily numbers available: I think it is unreasonable to expect William to lose if there is an unbelievable downward spike that only exists for a day or two. If a spike lasts longer than that it is more believable. So as a compromise, I suggest Rob gets to choose any 16 consecutive days with data and William can choose the lowest two days to exclude. The average of the remaining 14 days is used to determine the outcome.
Cobarde! ;-)
Below 3 million square kilometers? I'm still willing to bet, but 20 instead of 50 euros. And I insist on IJIS daily minimum extent, because it's more fun. Who wants to wait until the month is done so the average can be calculated (yawn)?
[But if I switch to daily extent I'd have to redo my numbers, and the min would be lower. Plus it is less Scientific and I am still trying to pretend -W]
"remember that what we're aiming for is a bet that both sides regard as a sure-fire win for them"
That's why I won't bet either way. :)
Someone correct me if I'm wrong but I believe Mr. Connolley has proposed a bet that he would win even if the September ice extent through 2013 precisely followed the extrapolated extent trend line in the figure from Hot Topic.
Brian? Shurely shome mishtake?
[Oops: corrected. I know who you are really... -W]
By "essentially no" Sept sea ice, I'd suggest 1m km2.
[OK -W]
And Jon's right. One of the key points of that graph is that there could be no new record for three years, and it would still be possible for extent to crash.
[The 3 years came from Neven's timescale. I could make it 5 if you like -W]
There might be more potential counterparties for the bet if the analysis didn't involve "being pessimistic"/"erring on the safe side" and then adding an 866,000 error margin on top of that. Maybe the error margin would be reasonable (I'm not sure about the multiplication by sqrt(3) but it's not an area in which I claim expertise) applied to an analysis intended to be realistic but it strikes me as hard to justify when applied to an analysis already intentionally pessimistically biased.
Gareth - ummm... the scenario in which extent follows your figure through 2013 would produce a new record in 2013, if not in 2012, wouldn't it?
[My argument for the sqrt(3) is: 0.5 is the interannual variance, so to be safe I take my projected value and add on that much fluff. But that applies to a single year. If I need to cover 3 years, then obviously I need more fluff to cover the greater chance of something unlikely happening. I think sqrt(3) is the correct factor.
As for me erring on the safe side: yes I am. But this, remember, is intended to be in response to people who (I thought) were making very pessimistic predictions of low future sea ice levels. It may be instructive to discover that actually we don't disagree by all that much after all -W]
William: are you saying you're willing to be on no new record for 5 years, or that min extent won't drop below 1m km2 in that time?
[Just done a minor update: happy to bet on the ice staying above 1 (m km2) through 2016 (monthly average of course) -W]
Jon: Yes, you're right. I should have checked my own graph first!
I'll bet on "essentially gone by 2016", as long as we're looking at the daily minimum rather than average over a month
[See reply to Gareth. I'm afraid I have to insist on the monthly averages -W]
William,
Many of us amateur Arctic sea ice watchers have extensively discussed the differences between the PIOMAS volume numbers and the ice extent numbers, on Neven's blog and elsewhere.
We have seen the presentations from Gareth and from Prof. Maslovski using PIOMAS, and IPCC model presentations such as Tietsche et al.
After all this evidence, I conclude that the IPCC models underestimate albedo effects and overestimate ice insulation. I think thus that the Arctic is more sensitive (to GHG forcings, or warming in general) than most models suggest. I think the PIOMAS numbers are real, and there is nothing in the way of volume collapse before 2016.
So I am willing to take your bet.
I will put $10,000 on the following statement :
"Ice extent, as reported by IJIS (IARC-JAXA), will dip below 3 million km^2 in 2011, 2012 or 2013"
or if you prefer a more dramatic bet :
"The North Pole will be briefly ice free in 2011, 2012 or 2013".
[Well, that is an amount worth discussing (we'll also need to discuss some form of verified identity). Are you prepared to do this based on monthly average? -W]
XREF to RC, where the statement was:
http://www.realclimate.org/index.php/archives/2011/03/under-and-over-th…
For comparison
> the North Pole ... briefly ice free
http://www.arctic.noaa.gov/npole/2010/images/noaa2-2010-0712-192526.jpg
>"Cobarde! ;-)"
Hardly, when he can get far more money on far better terms.
Given that William gets to win if the extent follows the Hot Topic graph of which William said
"This I don't believe at all, and if anyone is prepared to bet ..."
William has also pointed out that it starts from a low point rather than continuing the best fit line.
So the bet appears heavily in favour of William winning even if volume trend continues along its best fit line of the last 10 years. Williams bet really is miles away from his 50 years of summer sea ice remaining. However, I cannot really say there is anything wrong with that if he can still find willing bettors.
[Yes, that is true. Really I don't think the ice will disappear within 50 years. But that makes a dull subject for a bet, since it takes too long. Again, its a matter of finding things we disagree on -W]
If using IJIS data with daily numbers available: I think it is unreasonable to expect William to lose if there is an unbelievable downward spike that only exists for a day or two. If a spike lasts longer than that it is more believable. So as a compromise, I suggest Rob gets to choose any 16 consecutive days with data and William can choose the lowest two days to exclude. The average of the remaining 14 days is used to determine the outcome.
[Urk, no, that becomes far too complicated. And I don't think huge downward spikes are possible, without errors in the dataset. I've updated the post a bit -W]
I think you redid your numbers plenty enough as it is. Remember you challenged people to a bet for a new record low extent within the next three years? And then when I said I would be willing to take that bet, you had to 'redo your numbers' and came up with something that was more than 1 million square km less. What's next?
I know you have a reputation to uphold, but I don't, so this is my offer: under 3 million square km in either 2011, 2012 or 2013, based on IJIS daily minimum extent. I'm willing to bet â¬20, and â¬100 if the money goes to a good cause.
The odds still favour your position by quite a stretch, so I don't see a reason for you not to take this on. Or are you the only one who is allowed to set conditions?
Everything we are doing here is unreasonable, so I don't see a problem. It's just something that we can agree upon a priori, so if it happens, it happens. You can bet on a goal being scored in a football match between the 70th and 80th minute of the game. Who cares if the equalizer is scored in the 90th minute?
And like I said: it's more fun. I am trying to be funreasonable here, which given the context is proper conduct, I would say.
OK, what monthly average ice level *are* you willing to bet on for the period through to 2016? I'm willing to bet that there will be transient near-total ice loss, but I'm not going to get suckered into betting on a whole month of ice-free status.
I'm basing my bet on Maslowski's central date of 2016 +/- 3 years for "mostly ice free". To be fair, given that his definition was 80% volume loss relative to the historical average, if you believe PIOMAS we're essentially there already! I'm essentially betting that at some point prior to the end of 2016, the volume collapse will show up in the extent figures.
William, you wrote "But this, remember, is intended to be in response to people who (I thought) were making very pessimistic predictions of low future sea ice levels. It may be instructive to discover that actually we don't disagree by all that much after all".
When Maslovski and PIOMAS numbers suggest 2016 +/- 3 years for a mostly ice free Arctic, and IPCC models suggest 2070 or later, then there IS a serious and significant disagreement in the models.
In that regard, this (bet) is about recognizing the risk that we may be heavily underestimating the sensitivity of Arctic sea ice to warming trends. And recognizing the implications of being too conservative in our climate assessments. Remember that if I'm wrong, I will just loose some money. But if I'm right, Arctic sea ice is in state of imminent collapse, and we need to re-assess all projections and models not just for Arctic sea ice but also sensitivity of ice sheets and Northern Hemisphere climate. Not to mention figure out what to tell our kids about Santa's home..
You also write "Are you prepared to do this based on monthly average?".
Now let's see : So if sea ice minimum in 2013 is 2.99 million km^2, but the monthly average September 2013 is 3.01, then you want to claim a win ?
[Yes. Because I worked out my numbers based on monthly averages. I can redo all the calculations based on daily values, of course -W]
I'm basically betting that Arctic sea ice is going off a cliff, and you are negotiating the chest movement of the last heartbeat...
Sorry. No averages. My offer stands as is.
[In that case you'll have to wait a little while while I work out what the stats look like for daily vs monthly. Or maybe that CR will do it for me :-) -W]
> no averages
Isn't this offering to bet on the weather, not climate?
Hank, I think all will agree that a single ice-free day or two will be a striking sign of more to come. That said, it wouldn't be a surprise if it took some years for every summer to begin to reach that condition.
Ocenaographer of the (U.S.) Navy says four weeks ice-free in 2035-2040. He hasn't said, but I assume this is based on Maslowski's work. In any case, as was discussed on this blog a couple months back, such a projection is entirely consistent with Maslowski's projection of that first day or two in 2016 +/- 3 years. IOW, a bet favoring an ice-free month sooner than 2035 amounts to a bet *against* Maslowski. So it'e interesting that the wily WMC isn't willing to bet straight-up against Maslowski. But then I've always thought the latter had the pole position in this race.
[I though M was predicting an ice-free Arctic by 2016. Or maybe not; I didn't pay that much attention. As to the day/month thing: I'll update the post header -W]
Of course it is. Extent is in large part determined by weather. But the climate is preconditioning the ice.
I believe that if weather conditions similar to those of 2007 occur, there will be a new extent/area/volume record. Even less than similar will do in the coming 3 years.
I believe the difference between daily and monthly IJIS SIE minimum is approximately 200K square km.
New proposal: we bet â¬20 on the daily minimum being below 3 million square km. And I suggest we bet â¬20 on the monthly minimum being below 3.2 million square km. In either 2011, 2012 or 2013.
That would only be fair. And: double fun.
Hmm, I guess my expectation is for something like a more extreme version of summer 2007 when it happens the first time, rather than some sort of smooth-ish retreat.
[But summer 2007 was a record on the monthly scale, too -W]
IIRC M's prediction was not for an initial ice-free period that would have any staying power. Based on M's comment about a sudden melt and my own physical intuition (please, let me have my illusions!), I expect a sort of mini-tipping point that's reached when the pack thins to the point that it loses coherence (i.e. turns into a sort of ice archipelago, the individual pieces of which are more vulnerable to melt). As warming progresses, the average length of the ice-free (whatever value of that we're assuming) periods would lengthen, with plenty of inter-annual variability but after a while precluding any years without such a period. The alternative seems to suppose that the ice-free state would have some persistence, and not just a little in order to get to anywhere close to a month at first, which seems unlikely since we're talking about the very end of the season at a time when the lack of insolation starts to have its inexorable way with things.
To clarify: IIRC M's prediction was just for some ice-free period, not necessarily very long.
[It might be helpful to see his exact words. But it is impossible (in any scientifically credible way) to forecast a brief (less than a month) ice-free period across the whole Arctic. Any years-ahead forrecast of large-scale ice-free-ness is necessarily on a long time scale -W]
Well, as Neven says, September monthly average is running about 200 above the daily minimum. Since you're happy to take 1 million as "essentially ice free", I reckon a [i]transiently[/i] ice-free year would have a September monthly average of 1.2 million or so.
Allowing myself a reasonably wide fluff margin, like you're doing, I'm prepared to bet £50 that the September monthly average will go below 2 million some time between now and the end of 2016. Bet voided if there's one or more Pinatubo-scale eruptions between now and then.
Are you in?
Side note to those arguing about monthly/daily: the NSIDC monthly minimum is usually very close to the IJIS daily minimum. You could agree to use the former as a compromise position :-)
I like Larry Hamilton's Extent fit
=7.551*exp(-exp(-.1036*((2036-year)-18.912)))
which gives
2011 4.43
2012 4.18
2013 3.92
2014 3.65
2015 3.37
2016 3.09
2017 2.80
2018 2.52
2019 2.23
2020 1.95
Your best fit through all of the NSIDC Sept monthly average gives 5.23 - 0.0813 per year but you have said that loos about 0.4 too high so 4.83 - 0.0813 per year.
By 2014 there is a difference between the two systems of 4.67-3.92 = 0.75.
However I require the same safety margin as you. If you keep this as rediculously high as 0.5 * sqrt (years) then we cannot find a bet. For 2013 we would need a difference of 2*0.5*sqrt(3)=1.73. For 2020 the gap has grown to 2.15 but the safety margin we both need has grown to 3.16.
[The sqrt(n) applies not to how far forward, but to how many years. If you want to bet just on 2020, then the margin drops back to 0.5. Similarly if you just want to bet on 2016, the margin is 0.5. It only grows if you want to have more chances to win than me: for 2020, you only have to win one year and I have to win 10 (yes? I'm betting it stays above X for those 10 years; you're betting it will be less on any one year. This is asymmetrical) -W]
I think this just shows how rediculously large the safety margin you are requiring is.
So do you actually believe in imminent Arctic sea ice collapse but are just hiding behind that ridiculously large safety margin or are you willing to bet on the sea ice being higher than the midpoint of these two models?
If you are willing I was thinking of a bet of about £200.
>"[The sqrt(n) applies not to how far forward, but to how many years.]"
Ahh, OK sorry for mis-understanding.
So first year where gap is over 1m is 2015. We bet on 2015 only. Larry's formula 3.37, your est 4.51. Midpoint is 3.94 and this gives us both more than our 0.5 margin. In the event of a VEI6 or more pinatubo style volcanic event, delay bet outcome until 5 years after volcanic event then try to tell which trend looks nearer to being correct had volcanic event effects not occurred. If still not clear due to volcanic event either delay another couple of years if result then likely to be clear or void bet.
[If we're going to 2015, I'm happy to do without the volcano protection. Oh, except it is you that need it. Oops. In that case, I think the best thing to do is just call it off in the event of a large enough eruption. We can fix it at VEI-whatever... 6? I'd prefer to say, we treat this as a gentlemans agreement, and it gets cancelled if something that "obviously" throws it out happens -W]
Actually, a better way for us each to have one chance to win is to use all 6 years data 2010-2015 to determine the trend for those 6 years. If it is more steeply downward than the trend of the midpoints then I win and if less steeply downward you win.
Perhaps we ought to offer bets on, if not single years some distance in the future, on small sets of years in the future. I suspect very few of the people who would be willing to bet on, for instance, an extent lower than 1 million square kilometers by 2020 believe it's going to happen in 2011 or 2012 or 2013. And, if they do, they probably believe it will then happen again some other year between then and 2020. So maybe it would be possible to negotiate a bet applicable only to say 2018 through 2020. Of course, then it can't possibly be settled before 2018 but so be it.
Or perhaps it would make more sense to bet on the average September ice extent over multiple years? I'm not sure how William would decide how much fluff he'd need on a bet on the average extent for all Septembers from, for instance, 2011 through 2015 but presumably taking the average over five years would remove almost all of his concern over the effects of interannual variance and his desired fluff would be much smaller, possibly small enough to be small relative to the magnitude of disagreement between he and his potential betting counterparties.
[Betting on the average extent of, say, 2018-2022 would reduce the margin required, so that would be good. The problem with bets out to 2020 is that its a long way away, and patience is finite. But certainly I don't expect the ice to go below 1 msqkm by 2020; or 2030 for that matter -W]
William, I don't think M specified any period. Regardless, do you think it doesn't make sense to expect that the initial ice-free period will be relatively brief and that not all of the immediately following years will have ice-free periods? If you think that scenario is implausible, your position makes more sense to me.
[As I understand it, the M position is based on the trend line of the ice volume. If that has gone down to zero - or near-zero - then the M-type prediction is that it will stay there -W]
Here's a project from another place and time, perhaps another universe, perhaps worth a look. It's a geoengineering proposal from 1969, for warming Siberia by rearranging the Arctic ocean circulation.
http://books.google.com/books?id=SwcAAAAAMBAJ&pg=PA43
[Yes, people had fun thinking thoughts like that in the olde dayes -W]
Hank, That's what I like to see.
These guys were real go-getters. Melt the Arctic in 3 years. Benefits from the process from year 1. I'd really like to see an engineering proposal for the size of the pumps they had in mind.
(I really thought they'd be in the E Teller camp. Use an atomic bomb to modify geography - a harbour for Oz's Pilbara iron ore operations being one proposal. But no. Simply pump one ocean, Arctic, into another, Pacific, so the third in the chain, Atlantic, could rush in and warm the tootsies of all those Siberian residents wanting a proper beach holiday.)
*kick*
New proposal: we bet â¬20 on the daily minimum being below 3 million square km. And I suggest we bet â¬20 on the monthly minimum being below 3.2 million square km. In either 2011, 2012 or 2013.
I take it you do not wish to bet, despite odds heavy in your favour?
[Sorry, I thought I said I needed time to work out the numbers; I'll do so, but it will take a little while. There isn't any hurry, is there? But finding and looking at the appropriate daily numbers will take a little while -W]
These guys were real go-getters. Melt the Arctic in 3 years. Benefits from the process from year 1. I'd really like to see an engineering proposal for the size of the pumps they had in mind.
[blockquote]There isn't any hurry, is there?[/blockquote]
The ice is melting as we speak! ;-)
Just kidding, take your time.
William,
While you are work out the numbers, and contemplate accepting my $ 10,000 bet, let me add that I have been wrong before. For starters, my baby is still not born, and I was pretty convinced she would see the light of day a few weeks ago..
Also, while you check the variability of summer ice minima, could you please also finetune your scientific opinion on ice minima. After all, in the "This year's sea ice" thread you admit that you "waves hands for effect" and refer to "excess cold" being available in winter, and a "sort of stabilising effect" refering to the melt available in summer. Neither of these statements sound particularly convincing scientifically.
Specifically, could you please comment on the Tietsche et al presentation which apparently assumed (calculated?) only 10 W/m^2 for the albedo effect, using IPCC models. With more than 200 W/m^2 Arctic summer insolation (ISCCP-D numbers) and 0.66 albedo difference between ice and open ocean, a 10 W/m^2 number for albedo seems grossly underestimated, don't you think ?
I'm sorry. It seems that Tietsche et al determines some 25 W/m^2 albedo effect (Fig 3, July SW anomaly). Still seems exceptionally low, considering that ISCCP-D reports some 250 W/m^2 in the Arctic.
[Ah, that makes far more sense. Its the clouds, or at least that is what I would expect. Mostly the area is cloud-covered -W]
>"[If we're going to 2015, I'm happy to do without the volcano protection. Oh, except it is you that need it. Oops. In that case, I think the best thing to do is just call it off in the event of a large enough eruption. We can fix it at VEI-whatever... 6? I'd prefer to say, we treat this as a gentlemans agreement, and it gets cancelled if something that "obviously" throws it out happens -W]"
I am happy with NSIDC monthly average and gentlemans agreement I am also happy to give you protection against major meteroite strike or whatever "obviously" throws it out. In the event of VEI 6 or more volcanic event or anything else that "obviously" throws it out during Apr 2011 to Sept 2015 then it gets cancelled. If during 2015 something obviously throws it out, then I would prefer to use whether linear trend of 2010 to 2014 inclusive actual data is more steeply downward than the trend of our mid-points to decide who wins.
I win if Sept 2015 less than 3.94m km^2. £200 stake each.
At the present the total Arctic/Antarctic sea-ice cover is about (it fluctuates daily) 1.5 million sq km below the 1979-2008 mean. That's about one sixth of the area of the U.S. Looks like a sucker bet to me.
Oh, and the daily variation is quite large. I wouldn't go for the monthly average, if I were you!
William: I'm late to the game, but I think some of your sqrt business is wrongly aimed.
If we take there being a gaussian standard curve to variation about the monthly mean being of about 0.5 million km^2, it's easy enough to estimate (gaussian, independent) the daily standard deviation being 0.5 * sqrt(30), so 2.7 million km^2. The 0.5 representing interannual variation, 2.7 being daily ('weather') variation.
One problem being, there's no way that daily variation is that high. If 2.7 were the 1 sigma value, we should see double that about once a month -- thence should already have seen an ice free Arctic several times. If anything, the variability day to day is smaller than year to year. (Noting, by the way, that NSIDC, U. IL, and IJIS all present averages over some days -- not individual days.) I haven't previously computed it myself; like you, I favor months for doing comparisons.
[OK, and (as you know) the key failure in your assumption in indep. To all purposes, successive July monthly means are indep, but daily values in July are very strongly correlated -W]
For lack of anything better coming to hand, I'll take the daily variability as being 0.5 also. For the 3 year bet, you should be all over it. I'll neglect the trend over 3 years, but take a low extent to work from -- 4.25. That's 8.5 standard deviations away from zero. You win with probability (1-epsilon)^3, and epsilon is the area of the standard curve greater than 8.5 standard deviations away on one tail.
If you allow a 1 million square km floor, that only reduces it to 7.5 standard deviations, and an only marginally larger value of epsilon.
Not that I bet cash (unlike so many local denizens), but I'll take that 'no' side of a bet for 'Will the Arctic be ice free in 2011, 2012, or 2013'. Even quatloos, of course, as I like the odds heavily in my favor.
I presented one take on when the arctic might be ice free. You disagreed, with some merit, but at least in the early stages your concerns don't apply. The shaky part of this is that I ignored ice thickness (take the nice bait bettors).
[I'll need a bit of leisure time to ponder the rest -W]
altın çilek appears to just repeat posts. I assume this is just to get links to a site. Ideally such posts (and this one) should be deleted and blacklist altın çilek to prevent further spamming.
[I just removed the comment; I think you're right -W]
If something unbelievable like that happens, it would mean that WC had unbelievable odds stacked in his favour. In that case he shouldn't moan when something unbelievable happens.
If he wants a 100% safe bet, he should give me his IBAN and BIC, and I'll send him 20 EUR straight away.
"I just removed the comment; I think you're right -W"
altın çilek's post is still there (post #37), and the link is still available to his website.
http://scienceblogs.com/stoat/2011/03/sea_ice_-_and_now_for_somethin.ph…
[Hmm, that was odd. I'll never understand MT. Anyway, it should be gone *now* -W]
I see that Maslowski et al have been >a href = "http://www.bbc.co.uk/news/science-environment-13002706">updating their previous "2013 work" with some new modelling: 2016 +/- 3 years. I've done a quick trawl of the EGU but can't find a direct ref. Perhaps someone else will have more luck.
[Can't say I'm convinced. 4 years ago they predicted 2 years into the current future, or 6 years into the then-future. Now they are predicting 5 years in the current-and-then future. So presumably in an other 4 years they will be predicting 4 years into the then-future, and 4 years after that 3 years... its going to take them a while to converge. I won't be holding my breath -W]
>"[Can't say I'm convinced.]
I don't think many of your attentive readers would expect you to be convinced after saying things like "M-2013 is just obviously wrong".
The following seemed to suggest you were more willing to accept possibility that '2013' was possibly media hype to some extent:
"Also interesting to note is the absence of Wieslaw "no sea ice by 2013" Maslowski (to be fair to him, he was probably misrepresented. To be fair to reality, he made no attempt to correct this error as far as I know. To be fair to him, I made no attempt to find out)."
Haven't found where but I thought you were more accepting of a statement to the effect of
"If sea ice volume continues to decline at the current rate [i.e. pre 2007] then it would all be gone by 2013"
Presumably this acceptance would be on the basis that you don't think anyone sensible should believe that the ice would continue to decline at the same (or greater) rate.
Perhaps you have hardened your stance? If so, why? Is this through seeing 2013 used more clearly as a prediction by Maslowski rather than after an unlikely conditional clause? It surely cannot be that you just don't like the result and the evidence since then (FWIW) of continued rapid volume decline?
No possibility of admitting it may be reasonable to allow a change of date from 2013 to 2016 now it is based on modelling that hopefully removes that unlikely conditional clause?
Is Rob going to get any response to the middle paragraph in comment 32 (possibly comment 31 if you delete comment 30)?
Can we take "Can't say I'm convinced" to mean you won't be delaying deciding whether to take some of the bets on offer until after you have read the paper?
There's something seriously wrong with the Beeb article. M's 2007 AGU result was the very same 2016 +/- 3 years, although it sounds like he's kept working on it since then. Prior to that he put forward a projection of the then-current trend that showed things going to ice-free no more than a few years from now, but I don't think he suggested putting much weight on that.
First off : Thank you crandles. That was a good summary.
William, you are a professional climate modeler. You know the IPCC models (and any climate models in general) probably better than anyone posting here.
Arctic sea ice extent dipped below the 95% certainty margin already 5 years ago (IIRC) and (despite claims by contrarians like Watts) shows no sign of recovery to the expected curve projected by the IPCC.
Also, the PIOMAS and TOPAZ models clearly show accellerated sea ice volume melt, which seems to be on track to total collapse by around 2016 :
http://img543.imageshack.us/img543/2145/piomasmonthlyvolumes.png
These numbers are also seems consistent with Maslovski's model and his 2006 and 2010 projections.
Besides this, there is the confusion about Arctic albedo changes when ice melts.
The paper based on IPCC models (Tietsche et al) projects ice-recovery if extent gets too low, which is consistent with your opinion. However, they assumed (calculated?) only 25 W/m^2 for albedo changes. Above, you mention that "Its the clouds" but again that is not very scientific. In fact, since downward SW radiation in the Arctic is about half of TOA radiation, a bit of numeric series calculations reveals that in order to get half the TOA radiation on the ground, albedo effect 'through' the clouds should be around 25-30% of TOA radiation.
Incidentally, this is consistent with Gorodetskaya et al (2006) which obtains a 22% albedo change when ice turns to open water.
Since TOA radiation in July in the Arctic is around 500 W/m^2, a 22% albedo change is 125 W/m^2, which is also consistent with what Flanner et al 2011 actual observed :
http://www.nature.com/ngeo/journal/v4/n3/full/ngeo1062.html
Differences like this (25 W/m^2 in July versus 125 W/m^2 in July) are not insignificant, and they determine if Arctic ice will disappear at an accellerated rate as PIOMAS and Maslovski suggest, or if it will recover to some more linear trend as the IPCC models and Tietsche and you suggest.
I'd like to know on which side of this scientific inconsistency you are.
That's why I offered to bet with you. If you accept, then I sure hope that I will loose this bet. Because if I win, then Arctic ice will collapse on the very short term.
It's been three weeks now. Did you make up your mind ?
William... Are you still here ?
How about that bet ?
[Yes, I'm still here. But I've been busy, and now it is Easter, so you'll have to be patient a little while longer -W]
>"[Or maybe that CR will do it for me :-) -W]"
Only just spotted that. Not sure if what I am supposed to do is as follows but:
YearJAXA DailyNSIDC avgDiff
200256468755.960.313125
200360320316.150.117969
200457846886.050.265312
200553151565.570.254844
200657817195.920.138281
200742545314.30.045469
200847078134.68-0.027813
200952498445.360.110156
201048135944.90.086406
Average52873615.432220.144861
Units Km^2 or million km^2
I would urge both William and Rob to make the bet on the average of 2012 and 2013. This has two affects on the numbers. Firstly a decline from 4.9 in 2010 to 3 by 2013 is a decline of 0.6333 million Km^2 per annum so the average should be .3167 M Km^2 higher.
Secondly you each only have one chance to win so instead of 0.5*sqrt(3)=0.866 William's safety margin should reduce to .5/sqrt(2) = 0.354
So the new target for the 2012-2013 average becomes
3+0.317+.866-.354 = 3.829 M Km^2.
Neither of you seems to want to give in over the difference between daily and monthly numbers which appears to average .145. So I would suggest a compromise where Rob accepts monthly averages but gets about half the .145 as an increase in the target figure. This can be rounded off to a neat 3.9 M Km^2
[Thanks for the prompting. Next week, I promise, I'll update my graphs and try to formulate something mutually acceptable -W]
William,
I'm really not sure why you are having such a hard time deciding on this bet.
Below, I'll explain why you have virtually nothing to loose when switching from monthly average to daily minimum extent.
Here is the JAXA daily data set (covering 2002-present) :
http://www.ijis.iarc.uaf.edu/seaice/extent/plot.csv
From that, I extracted the September average and the daily minimum, for each of the 9 years in the record :
Year Monthly Daily
2002 5917047 5646875
2003 6126468 6032031
2004 5958901 5784688
2005 5530093 5315156
2006 5913271 5781719
2007 4380520 4254531
2008 4837036 4707813
2009 5382786 5249844
2010 5097088 4813594
Average difference between monthly and daily is 172995 km^2.
[Ah, yes, this is where we differ. I'm using http://arctic.atmos.uiuc.edu/cryosphere/timeseries.anom.1979-2008 (I want to use that because it is a longer series) which has slightly unclear provenance and an irritating date format. If I cut out a bit of 2002/09 from a rewritten version I get:
2002/9/2 4.1499448
2002/9/2 4.0817461
2002/9/4 4.1303039
2002/9/5 4.1548481
2002/9/6 4.0885448
2002/9/6 4.1176000
2002/9/8 4.0347104
2002/9/8 4.0366550
2002/9/9 4.0646768
2002/9/10 4.1067042
which bears no relation to yuor daily value (though the monthly values I have do agree).
So, the problem I have is finding a good commented daily min file back to 1979 -W]
Now hang in there, because here are your odds of winning this bet based on the Daily average :
First, I ran a linear regression over the Daily minimum numbers, using least square method.
I obtain a (down) slope of -148234 km^2/yr, and a 2000 starting point of 6176767.
Here is the table :
2002 expectation 5880298 measured 5646875 diff -233423
2003 expectation 5732064 measured 6032031 diff 299966
2004 expectation 5583829 measured 5784688 diff 200858
2005 expectation 5435595 measured 5315156 diff -120439
2006 expectation 5287361 measured 5781719 diff 494357
2007 expectation 5139126 measured 4254531 diff -884595
2008 expectation 4990892 measured 4707813 diff -283079
2009 expectation 4842658 measured 5249844 diff 407185
2010 expectation 4694423 measured 4813594 diff 119170
Then I calculated the de-trended standard deviation on the measured numbers (basically on the 'diff' between the linear trend and the actual JAXA numbers).
The de-trended standard deviation turns out to be 406386.
Using that standard deviation, I calculated how far the linear trend is away from 3 million km^2, over the years :
2010 expectation 4694423 which is 4.169486 SDs away from 3 million
2011 expectation 4546189 which is 3.804724 SDs away from 3 million
2012 expectation 4397955 which is 3.439963 SDs away from 3 million
2013 expectation 4249720 which is 3.075201 SDs away from 3 million
2014 expectation 4101486 which is 2.710439 SDs away from 3 million
2015 expectation 3953252 which is 2.345678 SDs away from 3 million
2016 expectation 3805017 which is 1.980916 SDs away from 3 million
2017 expectation 3656783 which is 1.616154 SDs away from 3 million
2018 expectation 3508549 which is 1.251392 SDs away from 3 million
2019 expectation 3360314 which is 0.886631 SDs away from 3 million
2020 expectation 3212080 which is 0.521869 SDs away from 3 million
...
Now, as you can see, based on the daily average, the linear trend in 2011, 2012 and 2013 is MORE than 3 standard deviations away from 3 million km^2.
So my chance of winning (dipping below 3 million km^2 on the DAILY numbers) is calculated as follows :
2011 3.804724 SDs = 0.5*erf(2.690346)= 0.5*1.41963E-4 = 0.0071 %
2012 3.439963 SDs = 0.5*erf(2.432421)= 0.5*5.81794E-4 = 0.0291 %
2013 3.075201 SDs = 0.5*erf(2.174495)= 0.5*2.10361E-3 = 0.1018 %
In other words, by going with daily JAXA minima, my chances of winning are 0.138 %, while yours are 99.862 %.
When I do the same calculation for the monthly average my chances are going down even further, since again, monthly numbers are some 173k km^2 lower.
Based on monthly numbers, my chances of winning diminish to a whopping 0.029 % (a factor 5 smaller than based on daily numbers) while you increase your chance from 99.862 % to 99.971 %.
As I mentioned before :
I'm basically betting that Arctic sea ice is going off a cliff, and you are negotiating the chest movement of the last heartbeat...
Please decide if you want to take this bet or not, preferably before I re-obtain sanity and withdraw my offer.
William,
OK, I regained sanity.
I am withdrawing my offer.
I explained above that the 3 million km^2 limit in 2011, 2012 or 2013 that you proposed is NOT realistic when we do trend analysis on the extent.
Even for trend analysis on volume, 2013 is too early (chances are still less than 50%). I'd be happy to re-engage in a different proposal, with a 2016 cut-off date. That is the point where volume trend is going to hit zero, unless some unknown effect will reverse the trend.
Are you OK to extent the bet to 2016 ?
[In principle, yes. We seem to have different data for the daily extent (area?) which needs resolving. But if we're going out to 2016 it becomes even less urgent, which is good! -W]
Rob
WC, the link provided is Cryosphere todays area not extent numbers. They go down to 2.98m in 2007 so there is a good chance of that going under 3m so I am suprised at you suggesting that data (unless the target gets revised). I thought you preferred extent to area numbers?
If going out to 2016 then a few extra days to wait for monthly averages makes little difference so there is less reason to avoid NSIDC monthly average figures.
Rob and William are you willing to consider a bet on average NSIDC monthly minimum for 2012, 2013 and 2014 or 2013, 2014 & 2015 or 2014, 2015 & 2016?
I have Williams predictions based on straight line through NSIDC monthly data from 1979 to 2010 less 0.4 M Km^2 giving the following:
2012 4.754
2013 4.672
2014 4.591
2015 4.510
2016 4.428
As I said at post 22 above I like Larry Hamilton's Extent fit
=7.551*exp(-exp(-.1036*((2036-year)-18.912)))
which gives
2011 4.43
2012 4.18
2013 3.92
2014 3.65
2015 3.37
2016 3.09
Average of Williams 2012, 2013 and 2014 gives 4.672
Average of my/Larry 2012/3/4 gives 3.917. Halfway between these two figures is 4.294 so we each have a safety margin of 0.378.
Maybe 0.5/sqrt(3) is a bit low for a safety margin but .378 seems well over that. This does have the advantage of finishing as soon as 2014.
However to avoid putting all eggs in one basket it may be sensible to split the bet(s) so part of the money has an early finish date and other money has a later finish date. So for 2013/4/5:
Average of Williams 2013/4/5 gives 4.591
Average of my/Larry 2013/4/5 gives 3.647. Halfway between these two figures is 4.119 so we each have a safety margin of 0.472.
For 2014/5/6 the midpoint is 3.94 with a safety margin of 0.57.
£67 on each of these three bets?
Thanks crandles for hanging in there with us. I respect to your suggestions to take average numbers and AND/OR conditions, but if William agrees, I personally prefer a simple bet.
William, I hope that crandles cleared up some of the confusion you seemed to have between 'extent' and 'area' numbers. I would not mind betting on either the extent or the area. In fact, I prefer a bet on 'area' numbers because that is more in line with the actual amount of ice around.
As a side-note, the 2016 cut-off date would nicely match with the Maslovski projection and with Gareth's blog post. Both of them, as well as the PIOMAS volume trend, show 2016 as a crucial timeframe. Something needs to change before that, or else Arctic ice volume collapse is imminent.
That's also why I want to extend the bet to 2016, and I'm glad that you are open to that timeframe.
Now, can we get to specifics ?
I'm OK with the original 3 million extent number, based on daily JAXA numbers, to be crossed before the end of 2016. According to the statistics I showed above, you should still be 2 SDs away from the trend line, and even accumulated over 5 minimas the probability of you winning the bet will still be more than 95 % (I could calculate it more accurately for you, if you like).
If you would rather switch to the 'area' numbers from Cryosphere, I'll first need to run my statistics as I did on the JAXA numbers, and then I'm sure we can come up mutually agreeable number.
After all, the difference of opinion at the core of this bet is rooted in the difference in trend lines between extent/area and volume. And by 2016 these trend lines are highly divergent. So I'm sure we can close a bet that meets in the middle somewhere.
Just a comment on perceived complexity: If averaging 3 numbers sounds too complex, then isn't finding the minimum number amongst a list of daily numbers not just once but upto five times (more/also too) complex?
Looking up a monthly average number at ftp://sidads.colorado.edu/DATASETS/NOAA/G02135/Sep/N_09_area.txt
is far simpler than finding minimums in a daily list.
Checking 5 numbers against a known threshold probably is easier than averaging 3 numbers before checking against a known threshold but only marginally.
NSIDC file above also allows area rather than extent. William has now given multiple reasons not to use JAXA daily numbers: not averaged, less scientific and record too short. I hope he won't mind me saying he doesn't mind using area as long as it is averaged. So to me, it looks like NSIDC monthly extent to avoid William having to rework numbers or NSIDC monthly area as you both appear to prefer/accept area. The alternative of Cryosphere Today's daily area numbers remains a possibilitity if Rob insists on daily numbers though it seems more complex and I haven't seen any reason for this if the numbers are going to be reworked.
William,
You presented sea ice "area" numbers as reported by Cryosphere, and thus I did an analysis of that data, plus an offer for a bet based on that data.
Here is the data source as you presented it :
http://arctic.atmos.uiuc.edu/cryosphere/timeseries.anom.1979-2008
I extracted the daily sea ice area MINIMA for each year, and ran a linear regression.
Here is the data and the linear regression results :
1979 measured 5306725 linear expectation 5529843 diff -223118
1980 measured 5507711 linear expectation 5464868 diff 42842
1981 measured 4956492 linear expectation 5399894 diff -443402
1982 measured 5139060 linear expectation 5334920 diff -195860
1983 measured 5386929 linear expectation 5269945 diff 116983
1984 measured 4695892 linear expectation 5204971 diff -509079
1985 measured 4992847 linear expectation 5139997 diff -147150
1986 measured 5381842 linear expectation 5075022 diff 306819
1987 measured 5288994 linear expectation 5010048 diff 278945
1988 measured 5144890 linear expectation 4945073 diff 199816
1989 measured 4815915 linear expectation 4880099 diff -64184
1990 measured 4628934 linear expectation 4815125 diff -186191
1991 measured 4460384 linear expectation 4750150 diff -289766
1992 measured 5026778 linear expectation 4685176 diff 341601
1993 measured 4472953 linear expectation 4620202 diff -147249
1994 measured 4816095 linear expectation 4555227 diff 260867
1995 measured 4410301 linear expectation 4490253 diff -79952
1996 measured 5238184 linear expectation 4425279 diff 812904
1997 measured 4899705 linear expectation 4360304 diff 539400
1998 measured 4262403 linear expectation 4295330 diff -32927
1999 measured 4204498 linear expectation 4230355 diff -25857
2000 measured 4168765 linear expectation 4165381 diff 3383
2001 measured 4533619 linear expectation 4100407 diff 433211
2002 measured 4034710 linear expectation 4035432 diff -722
2003 measured 4141664 linear expectation 3970458 diff 171205
2004 measured 4282973 linear expectation 3905484 diff 377488
2005 measured 4091798 linear expectation 3840509 diff 251288
2006 measured 4016919 linear expectation 3775535 diff 241383
2007 measured 2919439 linear expectation 3710561 diff -791122
2008 measured 3003555 linear expectation 3645586 diff -642031
2009 measured 3424597 linear expectation 3580612 diff -156015
2010 measured 3072129 linear expectation 3515637 diff -443508
The downslope in on this (best fitting) linear regression trend is -64974 km^2/year.
Also note that the linear trend will hit rock bottom (completely ice free Arctic) by around 2057, which is consistent with the IPCC model projections.
The de-trended Standard Deviation (essentially the SD on the diff between linear trend and actual minima) is 345600 km^2.
Based on this regression trend and the standard deviation (natural variability), I think that Cryosphere daily data to hit 2.5 million km^2 before the end of 2016 would work for a bet.
Here are the probabilities that I will win that bet based on this linear trend, for each year :
2011 3450663 which is 2.750757 SDs away from 2.5 million : 0.5*erfc(1.945079) = 0.29 %
2012 3385689 which is 2.562753 SDs away from 2.5 million : 0.5*erfc(1.812140) = 0.52 %
2013 3320714 which is 2.374749 SDs away from 2.5 million : 0.5*erfc(1.679201) = 0.88 %
2014 3255740 which is 2.186745 SDs away from 2.5 million : 0.5*erfc(1.546262) = 1.44 %
2015 3190766 which is 1.998741 SDs away from 2.5 million : 0.5*erfc(1.413323) = 2.28 %
2016 3125791 which is 1.810737 SDs away from 2.5 million : 0.5*erfc(1.280384) = 3.51 %
The total accumulated probability of me winning that bet is 8.92 %. Probability of you winning is 91.08 %, which puts the odds heavily in your favor.
Still, I'm will to bet, once again, since I expect very rapid minimum ice area reduction between now and 2016.
[Just a quick note that you can't add probabilities in this way (that would be obvious if two of them were >50%). Whether this is quasi-reasonable for small numbers I'm less sure -W]
So, in summary, this bet would read like this :
"Arctic sea ice AREA, as reported by Cryosphere [link] daily data, will dip below 2.5 million km^2 before the end of 2016"
Bet would be for US$ 10,000.
How about THAT proposal ? Is that acceptable to you ?
[I'm nearly there with the updated post (honest, it is half written :-). However, it is going to be based on monthly averages (sorry). I reckon you'll have to translate from daily to monthly using whatever scheme you like best -W]
http://latimesblogs.latimes.com/greenspace/2011/05/climate-change-arcti…
"The Arctic ice study by the International Arctic Monitoring and Assessment Program, titled Snow, Water, Ice and Permafrost in the Arctic (SWIPA), says that the feedback loops scientists have been warning about already are accelerating glacial melting in the Arctic, which accounted for 40% of sea-level rise chronicled annually from 2003 through 2008.
The executive summary of the report says ...."
https://www.documentcloud.org/documents/88367-arctic-ice-melt-2011-exec…
William,
It's now been more than 6 weeks since you posted this article. You proposed "remember that what we're aiming for is a bet that both sides regard as a sure-fire win for them", and I proposed bets and showed you that, using your own methods of trend line extrapolation, give you chances of winning between 91 % and 99.97 %.
Still you did not engage in a bet, and instead promised another update, based on 'monthly averages', but fail to mention which monthly averages. If you would just post the data that you feel most comfortable with, then I can propose a bet for you that give you a 90%+ odds of winning (again based on your methods of trend line extrapolation).
You wrote "this, remember, is intended to be in response to people who (I thought) were making very pessimistic predictions of low future sea ice levels. It may be instructive to discover that actually we don't disagree by all that much after all".
Once again, I propose that ice volume data and albedo effects reported in various scientific papers suggest that there IS an actual disagreement about how fast Arctic sea ice will retreat in the near future.
And I am willing to bet on that.
Almost off-topic, but this is worth a watch:
http://www.bbc.co.uk/iplayer/episode/b0110ghk/Storyville_20102011_Last_…
William, #55 from pembe maske is spam. That irritating Turkish spam.
[Ta, removed. Ironically, *this* is now comment 55 :-) -W]