
Arctic Methane Emergency Group? refers. Via GP I find this discussion on a "geoengineering" newsgroup (gosh how quaint - people still use newsgroups? Maybe retro is back). AJL finds my article "damming" but Ken C finds it "a little distasteful". But both are worried, quite rightly, about credibility if the AMEG's wilder claims (and people) aren't challenged.
Ken C points to September Arctic sea ice predicted to disappear near 2oC global warming above present (JGR, doi:10.1029/2011JD016709) which is interesting, because that is very non-catastrophic and very non-nearterm: 2 oC puts it at ~2070 or something, depending on your scenario.
A recalibration of an ensemble of global climate models using observations over 28 years provides a scenario independent relationship and yields about 2oC change in annual mean global surface temperature above present as the most likely global temperature threshold for September sea ice to disappear, but with substantial associated uncertainty.
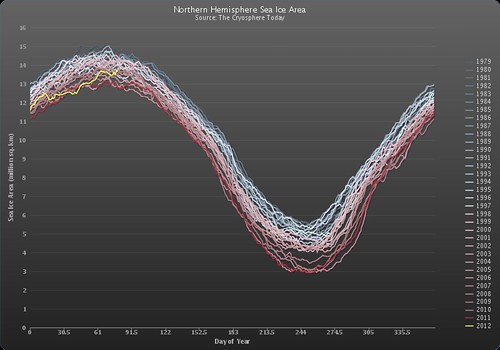
Which brings me on to Now, and Cryosphere Today has a nice interactive chart, which I've inlined above (see-also). This year - yellow - seems quite wobbly; from bumping along the bottom it is now well up in the middle of the pack. But that is midwinter; there is still all to play for in the year ahead.
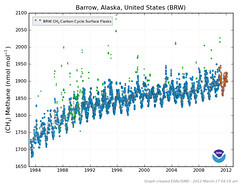 Switching very briefly to methane (the AMEG people were a bit annoyed their nice discussion had got hijacked by sea ice), the pic here shows... nothing very exciting. And it is Barrow, not global, per special request of Eli. This provides some kind of constraint on the hugeosity of whatever methane release is occurring in the Arctic.
And so, in the end, back to the Dark Side, where Watts had some story about sea ice. I ignored the bit about the Skate - if you're interested, Eli has the story on that, and the other half too. But the bit about IPCC '90 using pre-1978 sea ice was more interesting. Its true, they did (though it was a surprise to me). Presumably because back in 1990 the SSMI/R record was rather short, and it wasn't obviously silly to use other stuff (for the full story, and exactly what other stuff, read RMG who knows). Anyway, I guessed wrong: it wasn't ESMR (couldn't have been, as RMG points out, because there would have been gaps). But what is fun, if you're a detatched spectator, is how the Watties once again jump onto the good old conspiracy theories of how things were pure then but the global conspiracy has subsequently conspired to wipe out any memory of our giant reptilian overlords whatever. This is definitely a case where you don't need fancy explanations for their errors. There is a constant stream of junk, no time to think or evaluate, and no need anyway - its all denialotainment, nothing real, and like the headline in the Daily Mail will be conveniently forgotten very soon.
Oh, and don't mention Scafetta.
Refs
* Anthony Watts Misleading His Readers About Surface Temperature Record - it might be convenient to put this where I might find it again
* How reversible is sea ice loss? J. K. Ridley, J. A. Lowe, and H. T. Hewitt
Final note : it looks like M&K is not the only one who confuses sea ice 'area' with 'extent'. The graph I showed has the caption "Ice area or extent" on the Y-axis.
FYI, the graph came from this posting :
http://www.metoffice.gov.uk/research/news/sea-ice?media=6829
This is a very beautiful and interesting research
The most educating one i have read today!
GED Online
Talking about Scafetta over there someone mentioned him as a worthy successor to Landscheidt. Laissez les bons vieux temps rouler.
paper behind a pay-wall, but a poster is free:
http://conference2011.wcrp-climate.org/posters/C11/C11_Mahlstein_M137A…
It looks like they used SeaIceExtent, instead of volume (Piomas), as I would have guessed as the more convincing metric.
[Why is volume better? Extent (well, area, but extent will do) is what matters -W]
William,
On the sea ice decline estimate (2 C above current for ice free summer), I agree that this does not sound much different from the current IPCC estimates.
If they re-calibrated the models, but still get largely the same result, do you know how they got to explain the significant discrepancy between models and actual Sept sea ice decline from the past decade ?
Did I miss something here ?
[I only skimmed their abstract, I haven't read the paper. They say Overall, models however strongly underestimate the recent sea ice decline. Here we show that this can be explained with two interlinked biases. Most climate models simulate a smaller sea ice area reduction per degree local surface warming. Arctic polar amplification, the ratio between Arctic and global temperature, is also underestimated but a number of models are within the uncertainty estimated from natural variability which sounds like a rather dodgy re-scaling of the models. I think you either need to reproduce the current obs in the raw models, or explain them away as variability -W]
>"Why is volume better?"
Volume is largely a measure of the heat budget. Extent can be high with thin ice that will rapidly disappear. OTOH Volume decline is more likely to slow down as ice approaches zero. So if you insist on linear extrapolation then it is possible that extent is better. However, that doesn't mean linear extrapolation is the correct extrapolation.
[Linear is what you do if you have no better theory; I don't think there is any implication that it is "correct", though it may be easy to forget that.
Area is most important for ice-albedo feedback, for which volume doesn't much matter. I've struggled to articulate my others reasons before, and obviously failed -W]
Even if area/extent is better than volume, if there is a discrepancy in the predicted outcome shouldn't this be explained?
[I think it is intrinsic: they can't give the same results -W]
Why a linear extrapolation of extent? Don't the models show a declining slope of extent as ice approaches nil in September?
[Dunno. But we're so far away from zero extent that hardly matters -W]
If PIOMAS volumes are reasonably accurate and albedo feedback continues to be more important than the fast freeze with thin ice negative feedback then extent decline could easily accelerate rather than slow down as the models show. So simply assuming a linear extrapolation for extent seems pretty dodgy to me. However, I haven't read the paper and there is probably explanation for the choice made in there.
>>"Don't the models show a declining slope of extent as ice approaches nil in September?"
>"[Dunno. But we're so far away from zero extent that hardly matters -W]"
http://www.realclimate.org/images/seaice11.jpg
from
h..p://www.realclimate.org/index.php/archives/2012/02/2011-updates-to-model-da…
Maybe that isn't clear.
[It isn't clear what you mean by it. 4 is miles from 0 -W]
>"[Area is most important for ice-albedo feedback, for which volume doesn't much matter. I've struggled to articulate my others reasons before, and obviously failed -W]"
Maybe because we aren't seeing the logic/confirmation bias or maybe the reasons don't make sense making them difficult to articulate?
Are you suggesting that ice-albedo feedback is necessary for continued downward movement or do you regard ice albedo as being likely to *accelerate* downward movement or something else?
[Decline in area gives you a direct measure of how much ice-albedo feedback you've "gained". Volume gives you nothing similar -W]
Why shouldn't I take a view that without feedbacks the heat budget is melting X ice per annum but feedbacks affect that budget. albedo accelerates rate of volume loss per year while fast freeze of thin ice will tend to decelerate volume loss per year. There are other minor changes to heat budget eg greenhouse gas changes but AFAIAA those two feedbacks seem to be the major feedbacks (one dominating summer and one autumn/winter) from a review of the literature.
[Yes, fast freeze of thin ice is part of it. That will hardly show up in volume but matters for albedo -W]
Ideally we should be able to try to predict the volume of melt and freeze using a variety of factors and see which explains most of the variability. I will get around to attempting this sometime though it may be fairly inconclusive.
Could this lead to a better extrapolation than "linear because we have no better theory"? Is using shape from models better again though?
"Hugeosity ?" Whats wrong with "Hugosity"
i like to use "ginormity"
sidd
William,
I've posted on my blog last year about my doubts over claims of a sea-ice free Arctic this decade.
http://dosbat.blogspot.co.uk/2011/07/arctic-sea-ice-free-this-decade.ht…
Although I accept a lowered bar - virtually sea-ice free, with less than 1M km^2 area off the Canadian Arctic Archipelago (CAA). However the recent behaviour of PIOMAS has made me seriously question my position.
[I notice you discuss Tietsche there. That paper is really the same as "Schröder, D., and W. M. Connolley (2007), Impact of instantaneous sea ice removal in a coupled general circulation model, Geophys. Res. Lett., 34, L14502, doi:10.1029/2007GL030253." which they reference, but we got less notice. Were I still in science, I'd care :-). The recovery mechanism is why I didn't believe the 2007-death-spiral stuff. OTOH, according to that theory, 2011 shouldn't have happened. So, somewhere in between I'd guess -W]
First off, it's reasonable to argue that PIOMAS is 'only a model'. However in its defence: PIOMAS is well validated against available past data in terms of reproducing sea-ice thickness (DRA submarine obseervations & ICESat - e.g. Schweiger et al). The publicly available timeseries is the one that assimilates ice concentration and SST, Schweiger et al find it conservative. But PIOMAS also assimilates indices from NCEP/NCAR as its atmospheric forcing, so I broadly view PIOMAS as a pretty successful transformation program, transforming from atmospheric forcing to sea-ice response.
Here's my problem. During the last two Springs PIOMAS has shown massive volume losses in the daily calculated anomalies:
http://farm8.staticflickr.com/7069/6968923365_eb271a75ce_o.jpg
Whilst 2010 seems likely to be have been due to a persistent high pressure system (NCEP/NCAR), there is no such clear reason for 2011 either from NCEP/NCAR or AMSR-E SST in the Bering Strait region, I'm waiting to see what this Spring brings before commenting further on this matter. However these losses stand out in the context of PIOMAS results since 1979, and it seems significant that they are preceded by an increasing tendency to Spring losses, a tendency not seen in the preceding PIOMAS anomalies.
The thickness calculated from area (or extent) shows a regular behaviour over the PIOMAS period, since 1979. But 2010 and 2011 have a different shape.
http://farm8.staticflickr.com/7184/6968947697_28a4be7b83_o.jpg
This measure of thickness has to be treated carefully, for example its maxima is in the Summer, minima in the Winter, due to the biassing effects of thick ice of the CAA and thin ice in the peripheral seas, respectively. However it is a useful metric for discerning whether changes in volume are due to changes in area or changes in thickness, i.e. where calculated thickness doesn't change the change in volume is 'accounted for' by changes in area alone with little or no contribution from real thickness. This reasoning supports the idea that the recent Spring losses are due to thickness not area losses (with area being based on observations).
Here's a timeseries of PIOMAS volume.
http://farm8.staticflickr.com/7203/6801022094_7515a74805_o.jpg
In terms of volume the losses of volume by PIOMAS equal 2007, which makes it a substantial event in the model data series, indeed 2007 and 2010 stand out in the whole series. But while 2007 had a lesser impact on area calculated thickness, being largely driven by areal losses, there have been signficant reductions in area calculated thickness in 2010, maintained in 2011.
The aftermath of 2007 is an example of the importance of volume, what carried over the impact of 2007 if not volume? We've had various weather regimes in the intervening years yet area shows a persistent offset:
http://arctic.atmos.uiuc.edu/cryosphere/IMAGES/seaice.area.arctic.png
This perspective however presents a problem for what I'm saying about 2010's loss of volume. It might seem that the simplest explanation is that PIOMAS is reporting a volume loss that didn't happen, however this stands against PIOMAS's skill in reproducing thickness and its reproduction of the 2007 event, so that explanation raises the question - why is it failing now?
That's just one of the issues I don't have an answer for, in the absence of widespread thickness data (Cryosat is clearly too thick in the context of ICESat and DRA) I seem to have as many questions as answers.
I've read quite a few papers (e.g. Abbot et al, Eisenman) on bifurcations in Arctic sea-ice loss, and it seems to me that those studies might miss a rapid transition becase that transition may not be due to a bifurcation as such and may be in part a response to factors not considered in conceptual or 'toy' models, like the Arctic Dipole.
So to close this long comment, I find myself more open to claims that we may be on the verge of something quite breathtaking, I doubt a total crash to a sea-ice free state, a sigmoid type curve seems more likely, But another 2007-like drop to below 1M km^2 off the CAA? I'm not minded to argue against that at present.
Schweiger et al: http://psc.apl.washington.edu/wordpress/wp-content/uploads/schweiger/pu…
[I think that I don't know, really. I don't believe in the death-spiral stuff, but I don't think I've given convincing reasons for that. I do think we risk seeing a trend where there is only natural variation - it is entirely possible that 2012 could see a "recovery" to just the pre-2007 trend line. Or not; we'll have to see -W]
"I don't believe in the death-spiral stuff, but I don't think I've given convincing reasons for that."
I read most of what you write here but have no real expertise in this field. So perhaps it's helpful to know what I've gleaned.
-The "death spiral" scenario requires a dominant albedo feedback.
-But open water loses heat quickly, so you get a strong negative feedback.
-Extent will quickly (several years) stabilize at the equilibrium set by average temp.
If that's roughly correct then you've done a fine job explaining your position. If it's not, you've done a poor job *or* I'm just bad at this.
[That's pretty well it. Slight bit missing is that the "loses heat quickly" really applies to winter, which I why I think there is a strong recovery mechanism in place to replace ice lost over the summer -W]
>"[It isn't clear what you mean by it. 4 is miles from 0 -W]"
Yes some are miles form 0 but the general impression of shape is a sigmoid function.
>"[Decline in area gives you a direct measure of how much ice-albedo feedback you've "gained". Volume gives you nothing similar -W]
Yes (or almost as thin ice has higher albedo than thick ice) but you haven't answered the question of what effect that has.
[I'm not sure what you mean. I don't need to tell you what effect extra albedo has -W]
Volume change gives pretty much a direct measure of heat budget
[I'm not really convinced by that -W]
and next years heat budget is likely to be similar give or take natural variability (small when we average several years) and any feedback effects that are likely to be small for one year unless there is a big drop in area creating large albedo effect. So volume seems more useful than area to me.
>"[Yes, fast freeze of thin ice is part of it. That will hardly show up in volume but matters for albedo -W]"
I think it does show up in volume in some ways e.g. regardless of minimum volume and how early or late freezing starts the volume decline at maximum is not far from monotonic.
You hint at other 'part's but I keep expecting to see you write about these other parts in vain. But if blueshift has it pretty well and you have filled in the slight missing bit then the hinted at extra parts is effectively Schröder, D., and W. M. Connolley (2007)?
[That wasn't missing; I've written about that before -W]
>> Area is most important for ice-albedo feedback,
>> for which volume doesn't much matter.
and
> "loses heat quickly" really applies to winter, ...
> a strong recovery mechanism in place to replace ice lost
> over the summer -W]
Both hopeful.
Any thought whether more open water means more clouds?
[You'd need to know about the pre-existing state of cloudiness. Don't forget that sea-ice is a moisture source too; just that it is a bit colder than ocean -W]
facepalm, thank you for the link to that poster. That one is most revealing about this new paper by Mahlstein et al.
There are at lot of pieces of information on that poster that I find... well.. totally bizarre.
Let's first look at their estimate of "future" September sea ice extent (which they use to re-calibrate the CMIP3 models). Their formula goes like this :
SI(future) = SI(1980-1999) + ((dSeaIce/dTarctic)*(dTarctic/dTglobal))*dT
Where they define dT as the "global temperature increase".
The first really bizarre thing about this formula is that dTglobal is presumably also the "global temperature increase", and dTarctic appears both above and below the divide, and thus the entire right hand term reduces to dSeaIce.
Second, if we assume that that was just an innocent mistake, and they really just wanted to say that sea ice will decline in a linear fashion with temperature (which is what they claim in the text), then their "+" sign probably should have been a "-". Otherwise, SI extent would increase with temperature, which is highly unlikely.
Third bizarre thing about this formula is that if we set dT to 0 (being current temperature) then the estimated sea ice extent will be the average of 1980-1999.
Which was some 7 million km^2.
Well, that's one way to "calibrate" the model to "present" temperature.
Next bizarre issue are the images of the Arctic with expected Sept sea ice cover for +0.5, +1.0, +1.5 and +2.0 C "above present".
Here, for the 'red line' expected cover, the +0.5 C "above present" image, Sept ice cover is packed against both Canada and Siberia, Svalbart and Novia Zimblya. That would be a realistic picture for May or June (although this year ice the North Atlantic is already beyond that red line at some points, and we are presumably at maximum extent), but what was the last time this line represented the September sea ice minimum ? 1980 ? or earlier ?
The +1.5 C "above present" image is much more representative of Sept minimum over the past 5 years. Ice far away (1000 km) from the Alaskan coast, both North-West and North-East sea route open, and Chucki and Beaufort sea wide open waters.
What is troublesome is that the next step over (+2.0 C) shows a wiped-out Arctic.
So maybe the conclusion of this paper should be that another +0.5 C increase in global temperature should cause a virtual elimination of Sept sea ice in the Arctic.
However, even though that conclusion would make more sense than their current one, considering the vast amount of 'bizarre' information pieces that came with this poster, I would not even trust that projection.
blueshift,
I respect William's opinion, but do disagree with his "strong recovery mechanism" concept.
I think if there were some "negative feedback" that would stop and reverse the current quadratic downtrend, that it had 5 years time to manifest itself and reverse the trend.
It did not, and 2011 was almost at the point where 2007 was, even though 2011 summer was 'average' (no major wind induced ice export, and average cloud cover). Also, winter temperatures are consistently higher than average, which results in thinner ice in spring, which is then prone to more rapid melt in the next summer season.
So it seems to me that observations confirm that the positive feedbacks in the Arctic (albedo is just one of them) so far are still stronger than any negative feedback "recovery mechanisms".
Which means that there seems to be very little (or no) evidence that the current "death spiral" would come to a halt.
And for what it is worth, I really believe that William is wrong on this "recovery mechanism" and thus bet with him. Trend analysis of that bet done by Lucia, here :
http://rankexploits.com/musings/2011/connelly-dekker-bet-actually-robs-…
[This got stuck in the spam filter. Apologies]
William {[... do think we risk seeing a trend where there is only natural variation - it is entirely possible that 2012 could see a "recovery" to just the pre-2007 trend line. Or not; we'll have to see -W]
If you are right, then this year should show it : The winter North of Alaska was exceptionally cold, and wind patterns nicely distributed thickening ice from the Beaufort through the Chucki. This means the ice blocking the Bering street should be thicker than we have seen in a long time. If it takes the melting season too long to "break" through the Bering strait, then albedo amplification will certainly be reduced, and we may indeed see a much higher Sept minimum.
That's what positive feedbacks do : they amplify natural variability. Both ways.
On the other side of the Arctic however, warm waters through the winter kept open water up to 82.5 deg N above Svalbard all through the winter, and the Kara sea never really closed up.
With extra ice in the West, and less ice in the East, it's going to be an exciting melting season again....
The Arctic never stops to amaze.
There would seem to be sufficient justification in Influence of Initial Conditions and Climate Forcing on Predicting Arctic Sea Ice (E. Blanchard-Wrigglesworth, C. M. Bitz, and M. M. Holland, GRL 2011) to regard volume as more important than area. They also find that after 5 years the initial conditions have lost influence and the state of the ice reverts to that determined by climatology. They are not using initial conditions where the ice is totally removed, but the fact that they also see reversion to climatology at 5 years seems more than coincidence. Non-paywalled copy
I've spent significant time considering Tietsche et al. Unfortunately I've not found a (non-paywalled) copy of Impact of instantaneous sea ice removal in a coupled general circulation model - so I've only read the abstract. My reservations are similar to yours ("OTOH, according to that theory, 2011 shouldn't have happened").
OK, so the models are wrong (BREAKING NEWS!), why? Underestimating positive feedbacks, overestimating negative feedbacks, incorrect forcings or some combination thereof seems the only possible answer.
[I think there are others. Sea ice - dynamically - is intrinsically hard to model on a GCM scale. Also, in many models the sea ice is a bit of an afterthought - the atmospheric dynamics gets lots of attention, the ocean less so, and the bit in between even less. That is a function of the models history - they started off in the main as atmospheric models derived from those used for weather prediction, and you can still see that in the degree of love-n-care lavished on the various bits -W]
I would like to see the same model runs performed with realistic sea-ice mechanics and kinematics (IPCC climate models do not capture Arctic sea ice drift acceleration: Consequences in terms of projected sea ice thinning and decline),
[Interesting ref. I think the word "acceleration" is unfortunate, but the idea that the dynamics might be poor is reasonable. Another thing I would object to, in that study and elsewhere, is the lumping together of all the models as "IPCC models". Some of the models are poor, some good. They need discrimination -W]
correct boundary layer interactions (The Boundary Layer Response to Recent Arctic Sea Ice Loss and Implications for High-Latitude Climate Feedbacks), and a demonstrated ability to reproduce both the extent loss of 2007 and the equally dramatic volume loss of 2010.
I don't know how close we are to having GCMs with this capability, but until we do it's very hard to dismiss out-of-hand the predictions of Maslowski.
blueshift:
"-The "death spiral" scenario requires a dominant albedo feedback.
-But open water loses heat quickly, so you get a strong negative feedback."
[That's pretty well it. Slight bit missing is that the "loses heat quickly" really applies to winter, which I why I think there is a strong recovery mechanism in place to replace ice lost over the summer -W]
Isn't there is another possible "death spiral" scenario when the climate has warmed enough so the strong recovery mechanism during the winter is no longer sufficient to regrow the ice lost over the summer?
[I think that is the original theory, but its a bit hand-wavy -W]
So could a "methane emergency" be put forward to argue that tapping the sites for gas rather than reducing fossil fuel use is the best near term investment of time and resources?
https://duckduckgo.com/?q=methane+arctic+depressurize
[Actually using the stuff does seem to be one obvious idea. Since no-one is, I assume its quite expensive / difficult -W]
Papers citing Curry et al. 1996 on Arctic cloudiness
DOI: 10.1175/1520-0442(1996)009<1731:OOACAR>2.0.CO;2
most recently
http://adsabs.harvard.edu/abs/2012GeoRL..3905705L
"a 1% decrease in sea ice concentration leads to a 0.36-0.47% increase in cloud cover, suggesting that a further decline in sea ice cover will result in an even cloudier Arctic. "
I met Scafetta at a poster he gave somewhere last year (AGU? it all runs together...) and gave him a slightly hard time, probably more than I should have.
My impression is that he's not necesarily a politically driven "septic" in William's terms but that he's a curve-fitter by trade and sees everything through that lens. Quoting his Duke University personal page he has a toolbox and applies it to "astronomy, biology, climatology, economy, geology, medicine and social biology"; have method will travel, it's all the same. No need for this "disciplinary knowledge" nonsense.
It's the old saying, "if the only tool you have is a hammer, then everything looks like a nail."
[That might explain his rather odd wiki page, which says Scafetta developed Diffusion Entropy Analysis, a method of statistical analysis which distinguishes between Levy Walk noises and Fractal Brownian Motion in complex systems.[4] Scafetta's research first made news in 2002 regarding his analysis of teen pregnancy.[5] Scafetta used this method to publish a number of peer-reviewed articles in a wide variety of scientific disciplines, researching subjects as diverse as teen pregnancy, distribution of wealth, human gait, earthquakes and DNA -W]
William : Another thing I would object to, in that study and elsewhere, is the lumping together of all the models as "IPCC models". Some of the models are poor, some good. They need discrimination
Good point. But the question is which one is better and why ?
[Some of them are better because they have had a lot more time and effort spend on them overall. Or, you can measure them by the quality of their outputs in simulating the current climate (see, e.g., Connolley and Bracegirdle). Sea ice, in particular, varies wildly in quality between the models -W]
>"Isn't there is another possible "death spiral" scenario when the climate has warmed enough so the strong recovery mechanism during the winter is no longer sufficient to regrow the ice lost over the summer?"
Isn't this scenario obviously true rather than being possible? The mechanism of fast loss of heat though thinner ice causing fast thickness regrowth IMHO pretty well requires it. If at any stage in the freeze season the ice had recovered to previous years thickness then the mechanism for faster regrowth of thickness has disappeared and there is no logic to expecting thicker ice. Of course natural variation can cause thicker ice one year compared to the previous. This 'recovery mechanism' seems to always be less than a full recovery and I can see no way that can change.
Even if we make most optimistic possible assumption that it rapidly becomes so close to a full recovery mechanism as to make no difference, we might soon reach the point where we still see practically ice free conditions at minimum.
The reason for this is that the volume loss in melt season seems to be growing since 2007 and might soon reach 18-20k km^3 while maximum volume seems to be declining towards 18-20k km^3.
http://farm8.staticflickr.com/7110/6854185650_13cd29e6fe_z.jpg
http://psc.apl.washington.edu/wordpress/wp-content/uploads/schweiger/ic…?
> using the stuff does seem to be one obvious idea.
Do read the stuff on depressurizing methane clathrate deposits -- drilling in and removing the high pressure gas that comes out starts a process by which more and more gas evolves from the solid clathrate form:
http://scholar.google.com/scholar?q=hydrates+become+unstable+when+heate…
That can keep producing gas past the time standard metrics would have predicted that a reservoir should become exhausted. $$PROFIT$$ -- leading to building up a new industrial base and distribution system to go on using it.
Compare that to spending a comparable amount of money, time, and effort building up another energy source that doesn't end up increasing CO2. Not so easy, not so profitable, eh?
Hm. What was our goal here? Which path trends toward it?
Let's see if we can work out the 'methane emergency' logic as it would be applied by Business As Usual.
Hmmm. Ok, drill down into the clathrates to depressurize them; that starts the gas flowing, and as pressure in the strata drops more gas evolves so it keeps flowing.
Bring it to the ocean surface, or to the shore (either one risks plugged pipes and surges of pressure).
Burn some of it in big generators to run compressors to liquefy the rest of it ....
Hmmm, but BAU says flare it off to get at the oil underneath:
http://www.eia.gov/todayinenergy/detail.cfm?id=4030
Oh, do keep perspective on all of this:
http://www.agu.org/journals/jg/jg1102/2010JG001441/2010jg001441-op01-tn…
We're definitely heading for a sudden shock; the discussion is akin to deciding whether to phone in a rush order for driver and passenger airbags for quick installation on the fly, or just get everyone to fasten the seat belts, or try leaping from the moving vehicle before it gets where we've got it pointed, or, well, is it really too late to steer away from that precipice?
[That makes the methane look a bit spikier than my pic. The recent flattening off is important -W]
Re: Inline response #13
"I think the word "acceleration" is unfortunate..."
Why do you find this unfortunate? The difference between observations and model performance in this regard is the major finding of "IPCC climate models do not capture Arctic sea ice drift acceleration: Consequences in terms of projected sea ice thinning and decline" Do you have some disagreement with their methodology or conclusions? Since this *is* the major finding of the paper, isn't saying the choice of words is unfortunate tantamount to saying it shouldn't have been published?
[I don't think the ice is accelerating. Its just moving faster -W]
Rob Dekker,
With regards the Arctic Wang & Overland use the model reproduction of the seasonal cycle (a forced response of sea ice) to select those models best performing against observations. They then consider the projections from those models and find they project a nearer term seasonally sea-ice free state.
http://archive.mrc.org/pdf/WANG-OVERLAND-ARCTIC%20SEA%20ICE%20ESTIMATE…
William,
Thanks for pointing out your paper regards Tietsche, I can't recall my thinking on such details when I wrote the post, but assume I didn't pursue or mention your paper because my main interest was in the mechanisms behind the recovery. Tietsche et al claim your study didn't address the mechanisms. I hope life outside academia finds you well.
Regarding Blushift #8 and your reply; This negative feedback is in play at present (e.g. Screen & Simmonds 2010) I suspect it's a major reason 2007 didn't usher in a succession of massive area losses, indeed PIOMAS volume losses didn't really start to occur until 2010.
http://psc.apl.washington.edu/wordpress/wp-content/uploads/schweiger/ic…?
In principle I agree with Crandles about the significance of volume as a metric for energy gain in the Arctic. However it's a far from simple matter trying to unravel what's happening.
"I don't think the ice is accelerating. Its just moving faster -W"
Rampal referenced his earlier work: Rampal, P., J. Weiss, and D. Marsan (2009), Positive trend in the mean speed and deformation rate of Arctic sea ice, 1979â2007, J. Geophys. Res.
and this, I'm sure, would have been referenced: Spreen, G., R. Kwok, and D. Menemenlis (2011), Trends in Arctic sea ice drift and role of wind forcing: 1992â2009, Geophys. Res. Lett.
Am I misreading these papers - or are they saying that drift speed is accelerating?
[They are saying that the ice is going faster. But its not accelerating. That is why I said "accelerating" was a poor choice of word -W]
#24:"They are saying that the ice is going faster. But its not accelerating."
Looking at Figure 5 or 11 from Positive trend in the mean speed and deformation rate of Arctic sea ice, 1979â2007. Don't these show a continual increase in drift speed over time? It's not just that the ice is moving faster, but it's continually moving faster. In what sense is this *not* acceleration?
[I can't, its behind a paywall. I'm not sure I can make my position any clearer, though, not that I've tried very hard. We're talking about the wording, not the underlying reality. If you like their words, you are free to use them. I don't think viewing it as acceleration is helpful. Sea ice doesn't accelerate, in models, because the acceleration is always such a trivial part of the force balance that it is neglected -W]
#25 - Here's a non-paywalled copy of Positive trend in the mean speed and deformation rate of Arctic sea ice, 1979â2007, Rampal et al.
[OK, looks reasonable. Thinner ice is weaker and moves more -W]
And a non-paywalled draft of IPCC climate models do not capture Arctic sea ice drift acceleration: Consequences in terms of projected sea ice thinning and decline
[Thanks. That paper is severely weakened - to the point of uselessness, at first reading - by the way is sphagetti-plots all the IPCC models, even though it has a discussion that (rad correctly) admits some of them are useless for sea ice -W]
I understand your position, what I'm trying to decipher is whether it's based on the latest science (which would mean I've misinterpreted the papers). The whole point of the work by Rampal (and others) is to show that GCM deficiencies in modelling sea ice mechanics and kinematics explain the poor model forecasts of sea ice extent.
As GCMs incorporate A new modelling framework for sea ice mechanics based on elasto-brittle rheology, or something similar, I expect we'll see more accurate sea ice extent forecasts.
[EVP was the new thing when I left. Their figs 2 and 3 make it look like they need an insanely high rez -W]
Chris Reynolds, William,
Thanks for the useful links to Wang et al and Connolley and Bracegirdle.
Still, even these comparisons do not show any model that can hind-cast Arctic sea ice extent over the past three decades to within two standard deviations. All still seem to be way too high in their estimates, and suffer from identified and unidentified issues with the models.
For example, William and Bracegirdle finds MPI-ECHAM5 with the best 'skill score' for Antarctic/Global sea ice projections, but Koldunov 2009 finds that ECHAM5 - MPI is rather badly off on it's estimates for the Arctic (for example, it hindcasts 7 million km^2 + for 2010 timeframe) and they give several reasons on why this model is off:
http://www.ifm.zmaw.de/fileadmin/files/images/Staff/Koldunov/koldunov20…
[Yes, models remain stubbornly bad at the sea ice, and those that look good in one aspect often look poor in another. My suspicion is that either something is being missed (which would be good, as people would then have some hope of finding it) or that the problem is much harder than it naively looks (which seems more likely). Either way it probably means I ought to de-weight my faith in the model results somewhat -W]
Wand et al shows only 6 models, neither of which matches closely with actual decline over the past 3 decades, although the best "hindcast" fit (CCSM3) fits better with reality (although still starting too low and ending too high) and projects ice free conditions much earlier than the IPCC model average.
In fact, it seems that model assessments to find the 'best' model are more 'curve-fitting' exercises than assessments of the physics involved in Arctic sea ice decline.
Now, don't get me wrong. I think modelers and climate scientists are doing an amazing job. The Arctic, with it's many positive and negative feedback factors, and notorious non-linearity, is probably the hardest area of the planet to model,
But the problem is that we don't know the heat flows in and out of the Arctic very accurately. I think it was Serreze et al 2007, who reported that the Arctic energy budget has an uncertainty of something like 10 W/m^2. That uncertainty means an uncertainty of some 50cm/year of ice melt.
Tietsche et al 2010 is very interesting, since it identifies the "negative feedback" that seems to be inherent to most climate models. They simulate an ice-free summer gains some 10 W/m^2 in albedo effect, but that it should loose some 40 W/m^2 in fall, due to higher temperatures in fall. That difference would be gone by winter, when ice restored itself to it's average thickness and temperature restores to 'average'. 40 W/m^2 in fall would mean a temperature difference of some 12 C above the average in fall, which would indeed be a strong negative feedback mechanism.
However, in reality, even after the 2007 and 2011 large ice loss summers, DMI 90+ temps show that fall temperatures are not much higher than average, but the winter temperatures seem to be consistently higher than average.
So maybe there is an inherently different process at work than the models assume...
Somehow the heat does get out quickly (fast ice growth in fall) but somehow comes to a halt in winter, or there is a heat flow of some 10 W/m^2 (in winter) that we did not account for in the models...
>"Somehow the heat does get out quickly (fast ice growth in fall) but somehow comes to a halt in winter, or there is a heat flow of some 10 W/m^2 (in winter) that we did not account for in the models..."
Why "halt"? Can't what is being seen be a consequence of later start to freeze season?
Consider following as graph of ice thickness against time with progressively later start of freeze season:
http://farm8.staticflickr.com/7064/7020589229_3dc291cda1.jpg
While this shows an increasing rate of maximum volume reduction, I think it is very doubtful that start of freeze season gets later in a linear fashion.
Chris,
The graph you present suggests that ice growth through winter will reach an equilibrium, no matter what the starting date. That would imply that there is almost no "memory" in sea ice of the previous season, and I don't think it is that simple. For starters, ice growth rates during winter depends on many factors. Winter temps, wind over the ice, ice export, ridging, snow cover amount, and what kind of snow, and how it is distributed, and my favorite : sub-ice ocean heat flux during winter. Even if you ignore that each of these variables depend on other (weather) variables, and just take the 'average', then it is still hard to quantify how much the negative feedback of late ice growth would result in thinner ice the next season, and thus affect how next year's melting season is affected (with it's own positive feedbacks).
Many scientists have wrecked their brains [I hope you mean "wracked" there, but maybe what you wrote is more correct... -W] over these feedbacks and tried to model ice growth and melt and volume, to the best of their abilities. I do not want to argue with them, and I don't believe that model simplification would give us any more insights. I just noted that observations are consistent with the notion that positive feedbacks outweigh negative feedbacks on an interannual basis, or else we would not see a quadratic decline in overall sea ice extent over the past decade(s).
That all said, I think that the 2012 melting season will give us a lot of information on feedbacks and heat flux inbalance. The past winter was brutal in the Western side of the Arctic, with ice extending far beyond even the 1980-2000 average. On the East side (the North Atlantic) things are completely opposite. Ice free conditions to 82.5 deg North of Svalbard through the winter, and Novaya Zimblya's west coast remained ice free all winter as well.
So we have a situation where the West Arctic is "restored" to pre-2000 conditions and the East Arctic is very much on the "death spiral" path.
If, for a moment, we assume that there is not much "heat communication" between the West and the East over one season, then the local changes over melting season are going to be extremely interesting.
If 'local' feedback mechanisms (such as 'albedo' feedback) are dominant, then the Bering sea (and the Chucki and the Beaufort) should show pre-2000 ice reduction behavior, and thus should not melt out as they did in the past 5 years.
However, if more global effects are at play (such as heat input from lower latitudes, and land albedo chances due to faster snow melt, and my favorite : under-ice ocean heat flux) then the western part of the Arctic should melt out more rapidly.
And the effects on the East are equally interesting. Will the heat influx from the North Atlantic, combined with albedo feedbacks turn the North Pole into open ocean this year ? Or will wind-induced ice movement re-arrange the pack ?
Either way, it's going to be a very interesting melting season, and maybe after all is said and done, William might be right that the current low ice cover may just be an extreme case of natural variability.
We will know more in September...
Thanks Rob.
Sorry I didn't explain clearly. Curves were same indicating if given enough time they would reach same thickness (+/- noise) but that time is cut short. (Near) vertical line represents time of maximum. Let me try again:
http://www.flickr.com/photos/67566729@N07/6877468988/in/photostream
This is still a very simple abstraction and there is likely to be more to it. This also now tries to explain date of maximum getting later. Sharp turns are unlikely and probably need to be smoothed off.
Thanks, Chris. I feel where you are going with this, but I'm not sure if I understand which model you are actually using to create these graphs.
I still would like to get one thing cleared up. The Mahlstein and Knutti paper that William quotes above (at least the poster that was presented on it) seem to suffer from severe issues (see my post #11 above), some of which don't even pass the test of highschool mathematics. Did somebody read the paper itself (which seems to be behind a paywall), and did it suffer from the same issues ?
If not, I will buy the paper, and report here. As far as I know, Mahlstein and Knutti are trustworthy scientists, so I would not understand why they bring out a paper with such obvious flaws.
[Having looked at fig 1 of that poster properly, I think the one thing you can draw from that is that the model spread is so huge that using all of them is useless. You need to find a good reason to throw some away as being obviously bad, and if you can't do that, using them all just isn't good.
Looking at:
SI(future) = SI(1980-1999) + ((dSeaIce/dTarctic)*(dTarctic/dTglobal))*dT
you say "dTglobal is presumably also the "global temperature increase", and dTarctic appears both above and below the divide, and thus the entire right hand term reduces to dSeaIce". I think that "(dSeaIce/dTarctic)*(dTarctic/dTglobal)" is "over the calibration period" and is therefore a constant, whereas dT is continuously variable. However I can't see why dTarctic doesn't just drop out. Note that dSeaice/dTarctic is negative, so the "+" is correct. Presumably SI(1980-1999) is the temperature of the current seaice.
But I'm still unclear about the fundamental premise. If you're assuming - as they are - that the model response to temperature is linear, and then re-linearising against the obs... all that varies from one model to the next is dTarctic/dTglobal? So effectively the spread in the models becomes just a measure of their arctic amplificiation? -W]
Rob,
Re M & K, when I think people like that have made such a basic mistake the most likely explanation is that I don't understand. The problem with working off a poster or presentation slides is you don't get the detail you'd see in a paper.
The point about Wang & Overland is that without getting bogged down in the question of 'why' they use the forced seasonal response as a criteria to whittle down the models to a few that show the best reproduction of the seasonal cycle. They then reason that these should show the best response to the external forcing of AGW. In the process they discard a stack of models that show robust sea-ice throughout C21 and find the selected models have earlier virtually sea-ice free dates. So the point, a qualitative one is surely well made, the models that do the best job of capturing the forced response of Arctic sea-ice give faster recessions of the sea-ice.
Through additional reasoning my guesstimate is around 2025 to 2035. But the following year probably won't be virtually sea-ice free (under 1M km^2). Although as I posted earlier I'm more open to an earlier date than I have been for some years.
The feedback in Tietsche et al is happening now - it's the main driver behind Arctic Amplification. Temperature may not go up in Summer, but the energy gains then manifest themselves later through release of ocean heat and heat of fusion in the freeze seasons. I don't know about DMI but NCEP/NCAR shows temperature increase of around 3 to 6 degC over the Arctic Basin for Oct-Dec 2008 - 2011.
William, Chris,
I tried to buy the Mahlstein and Knutti paper, but it seems that AGU does not offer that option at this time.
So the poster is still all we have.
Taking a couple of steps back, I think I understand what they were trying to do :
Looking at the conclusions (2 C increase to ice free Arctic) and their note in the bottom-right coner, it seems that they wanted to get away from pedicting a 'date', and instead obtain a 'global temperature' difference for ice free Arctic.
Keeping that in mind, it kind of makes sense that they do a direct analysis of temperature versus sea ice extent.
And there the first thing they note is that the relation between sea ice extend and temperature is linear in the models (Figure 1), and they conclude in the paper that "total sea ice area is approximately linearly related to Arctic surface air temperature in models and observations".
With that 'finding' it then also makes sense that they set up their formula, showing a linear relation (by a factor ((dSeaIce/dTarctic)*(dTarctic/dTglobal) or dSeaIce/dTglobal). This factor is the 'rate' of sea ice decline following temperature.
Then they determine this constant based on observations over a 'calibration' period (they choose two such periods, but the 1980-2007 period (28 years) is the one they put most trust in).
Now exactly HOW the then 'calibrate' the models to the observations is not entirely clear from the poster.
But looking at their figure 2, they might have done something as simple as this :
They could have taken the mean of the dSeaIce/dTglobal observations (1980-2007), which is something like (7.8-5,5 Mkm^3)/(0.45 C) = 5 Mkm^3/C. And they could have calculated the mean of dSeaIce/dTglobal of the model runs over the same period. Maybe that was some 2.5 Mkm^2/C. So, they would find that the models are a factor 2 off in rate. Therefore they conclude "Most climate models simulate a smaller sea ice area reduction per degree local surface warming. Arctic polar amplification, the ratio between Arctic and global temperature, is also underestimated".
Thus, if the mean of the models predict that by 4 C global temp increase Arctic sea ice disappears (<1 Mkm^2), (which their figure 2 suggests) then their "best estimate" rate would be twice as steep, and thus lead to ice free conditions at 2 C above present.
Similarly, they can re-scale the variance in the different model runs by the same factor, and obtain a metric for the 'uncertainty' in the projection (the gray areas in figure 2 of the poster).
They did the same thing for the 1960-2009 calibration period, (which has a larger temp diff, and not much larger ice extent diff) and thus obtain a less steep slope for their 'blue' line in figure 2.
If they did something like this, then William's question : "So effectively the spread in the models becomes just a measure of their arctic amplificiation?" would be answered with, YES; M&K may indeed simply have 'rescaled' Arctic amplification in each of the models (or the model mean) to obtain the results they present.
Now the paper itself could show that the details of the 'calibration' are different, but the linear projection line in figure 2 seems to rule out much more complex assessments.
What do you guys think ?
[That seems about right. In which case, I hold on to my opinion that what they've done isn't really very useful. It is something you can do, and maybe it was inevitable that someone would do it, but that's all -W]
Rob, M & K 2012:
www.iac.ethz.ch/people/knuttir/papers/mahlstein12jgr.pdf
I've only skimmed this thread, so apologies if that is the wrong one.
Mahlstein and Knutti (2012), also their much more interesting 2011 paper proposing that a number of GCMs be voted off the island for failing to show the ocean heat transport leading to observed sea ice retreat in the Barents region.
[That looks interesting, I shall try to read it -W]
Vinny : thanks for tracking down the paper !
William said I hold on to my opinion that what they've done isn't really very useful
I agree with that, but I think it is even a bit worse : there are still some "bizarre" issues that simply don't make any sense at all.
For example, there seems to be something really weird about their "observations" :
Their figure 2 in the poster (and figure 2 and 4 in their paper), dots the "observations" (temp versus ice extent) over the 1980-2007 period, and it shows a 6.5 Mkm^2 ice extent at the start (1980 apparently).
However, NSIDC clearly shows that in 1980 sea ice extent in September was 7.8 Mkm^2 (even if you take the trend line).
http://nsidc.org/images/arcticseaicenews/20111004_Figure3.png
[They are using area, not extent -W]
Also, the same figure 2 shows at least a 0.6 C temp spread (over the 1980-2007 period) in the observations. But even GISS does not go that far (GISS anomaly difference between 1980 and 2007 is some 0.45 C).
http://www.woodfortrees.org/plot/gistemp/from:1980/to:2007/plot/gistemp…
[For illustration purposes in Figures 2 and 4 data onwards from 1970
are shown, but note that all analysis and results are based on
data after 1979 - so there is an extra decade in there -W]
Considering that their "observation" findings don't seem to match with the standard records, why did they not mention which records they are actually using ?
[They do, its on page 3 - W]
And how did they obtain their 0.96 "correlation" on the "observations" record, as they claim in the paper ?
NSIDC/GISS does not correlate THAT well, now does it ?
[Given the trend in T, and the trend in Ice, I wouldn't be surprised; but its not a very meaningful number, I suspect -W]
If we use NSIDC/GISS for ice extent and global temp, and we use the plain "linear" trends over 1980-2007 for both records, I obtain the rate I mentioned earlier (7.8-5.5 Mkm^3)/(0.45 C) = 5 Mkm^3/C).
[km^2 I think you mean - we're not on PIOMAS now -W]
At that rate, the "observations" predict an ice free Arctic only 1 C above "current", instead of their 2 C estimate.
[Yes, that looks about right by eye. But then, by eye, their figure 2 looks about right to be 2 oC. I guess that means the difference is in the use of area vs extent - if the ice is becoming more compacted, then the extent would decline faster than the area -W]
And my estimate (using observations obly) is not even taking into account the much steeper rate at which ice declined versus temperature over the past decade.
Doubtless obvious to most here, but there's a major apples and oranges issue among the various papers projecting loss of Arctic sea ice, noting that M+K are talking about a persistent loss (defined to be below below 1M sq km area) for the entire month (implying a much longer average ice-free period). Such an analysis ought to give a much higher temp and later date than e.g. Maslowski, who IIRC projects the median year for the first ice-free *day* (don't recall how he defined "ice-free").
[I'm not sure how much difference that really makes. The difference from daily min and monthly min isn't that much -W]
William, something is off with M&K.
You noted [They are using area, not extent -W]
and you are right, figure 2 in the paper mentions "area".
However, figure 2 in the poster (which looks awefully similar) mentions "extent".
So what is it ?
M&K figure 2 (both poster and paper) shows dots at 6.5 (supposedly 1970) and 4.8 (supposedly 2007).
It seems a bit hard to verify if they meant area or extent, since HADISST sea ice is in grid form (with concentrations), and it would take some time to extract Arctic extent and area numbers from that.
But I did find this one :
http://www.metoffice.gov.uk/media/image/a/8/figure1_400px.png
which suggests that in 1980 extent was 7.8 and in 2007 it was 4.2.
Now, since HADISST suggests extent numbers that are much further apart than M&K's figure 2 (and thus suggest an ice decline much steeper than M&K used in figure 2), it kind of does not matter any more if they intended area (paper) or extent (poster). But it does suggest that their estimate of 2 C is most certainly conservative.
I don't want to make any more suggestions than I already did, and since we already agree that M&K 2012 does not seem to be a very useful, I'd be happy to move on. But let it be noted that M&K 2012 seems to present overly conservative sea ice decline.
The 2011 paper that Steve Bloom presented seems to be more interesting, especially since the current situation (high ice extent in the west and small ice extent in the east (the Barents is especially low)) seems to confirm some of their suggestions about the influence of AMO on Arctic sea ice extent.
This userid links to the Arctic Methane Emergency Group; note Gavin's inline reply comments:
http://www.realclimate.org/index.php/archives/2012/04/arctic-sea-ice-vo…
[I think "albedo flip" is the keyword. Not insane in itself, but like anyone mentioning 2nd law of thermo in the context of the GHE, its a bad sign -W]
This is rather splendid.
A few decades ago, pingos (on land) were described as hills heaved up by ice; later they were found in shallow ocean margins, with streams of methane bubbling up from the top, and clathrates seem more likely to be pushing them. And there's discussion about interconnections between some of them, so they may be just the surface appearance of something more complicated going on.
And -- lo! -- shapes that appear they could be be collapsed pingos have been seen on Mars too: http://gsa.confex.com/gsa/2008AM/finalprogram/abstract_151571.htm