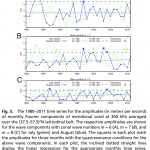
Arctic Sea Ice
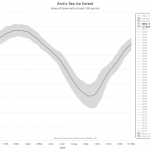
As we pass through Spring on the way to summer, the sea ice in the Arctic is starting to melt. The ice usually peaks by the end of the first week in March or so, then slowly declines for a few weeks, then by about mid-May is heading rapidly towards its likely September minimum.
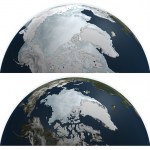
With global warming the ice has been reaching a lower winter maximum, and a much lower summer maximum. This is caused by warm air and water, and it contributes to global warming. The more ice on the sea for longer, during the northern Summer, reflects away a certain amount of sunlight. With less ice, less sunlight is…
The year 2016 was messy and expensive and full of climate change enhanced weather disasters. There were, according to Jeff Masters and Bob Henson, over 30 billion dollar disasters last year.
This is the fourth-largest number on record going back to 1990, said insurance broker Aon Benfield in their Annual Global Climate and Catastrophe Report issued January 17 (updated January 23 to include a 31st billion-dollar disaster, the Gatlinburg, Tennessee fire.) The average from 1990 - 2016 was 22 billion-dollar weather disasters; the highest number since 1990 was 41, in 2013.
The frequency of…
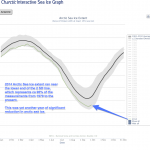
Arctic sea ice appears likely to reach a record minimum extent this year; as Greg Laden says, "It is almost like the Earth is warming up or something." The lowest extent of Arctic sea ice on record (since observations began in 1979) occurred in 2012, the second-lowest in 2007, and the third-lowest in 2015. On Stoat, William M. Connolley says it's currently at an "all-time low for the time of year, but only just, which is better than its been for the last few months." While the fate of the entire human race may hinge on the effects of global warming, Connolley also has $10,000 on the line.…
The Arctic Sea freezes over. The Arctic Sea melts. This happens every year. The average date for the maximum extent of Arctic Sea ice, based on a period of 1981-2010, is March 12. The minimum extent is reached, on average, about September 15h.
Every year for the last several years, the minimum ice has been much lower than average in extent, and many years in a row have seen record minima. This is considered to be the result of global surface warming caused by human release of greenhouse gas pollution.
It is said that we can't use the maximum ice cover to predict the minimum ice cover…
... and not in a good way.
The Arctic has, of course, been warming in step with anthropogenic global warming, plus more. This phenomenon has probably increased disruption to global weather systems, especially in the Northern Hemisphere, over the last decade or so.
But something somewhat novel is happening this year, presumably as a result of global warming combined with a strong El Nino. Storms are bringing extra warm conditions to the Arctic. A few days ago, the North Pole was above freezing, and over the next few days we are expecting more warm conditions in the Arctic Circle. See this…
I had considered writing an accounting of all the outlandish weather events of 2015, but that project quickly became a tl:dr list of untoward happenings which is both alarming and a bit boring, since it is so long. So, I decided to generate something less comprehensive, focusing more on the context and meaning of the diverse and impressive set of outcomes of anthropogenic global warming, an historically strong El Niño, and, well, weather which is already a pretty whacky thing.
See: Highlights of Climate Change Research in 2015
It should be noted right away that 2015 is the last year in which…
Every year the sea ice that covers the northern part of the Earth expands and contracts though the winter and the summer. The minimum extent of the sea ice is usually reached some time in September, after which it starts to reform.
Human caused greenhouse gas pollution has increased the surface temperatures of the earth, as measured on the land at about heat height with thermometers, and on the sea at the surface, mainly with satellites. Warming of the surface has continued apace for several decades, though with some expected squiggling up and down in how fast that is happening.
Greenhouse…
The National Snow & Ice Data Center has declared that the Arctic Sea ice extent has reached its annual minimum and is now starting to expand. I was thinking that it was too early to say this, since in past years what looks like a minimum can sometimes be reversed by some additional melting. But they are the experts, so I suppose we should go with it for now.
If this is the case, then this is the fourth lowest minimum in the good data set covering the last several decades.
They do hedge a bit. Here is what they say:
On September 11, Arctic sea ice reached its likely minimum extent for…
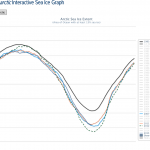
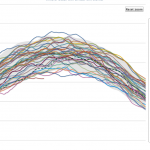
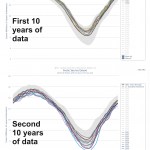
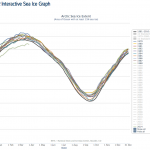
September is when the melt of the Arctic Sea Ice stops, and the re-freeze starts. We are probably not at the minimum yet, but the amount of melting is starting to level off so we can see where we are. The above graphic, made here (go and play with the interactive graph) shows the first ten years of ice freezing and remelting in the data set to use as a baseline for comparison, and the present year. Yes, there is much less sea ice on the northern end of the planet than usual.
This version of the graph shows the years with less ice, so far, than the present year. This includes the famous 2012…
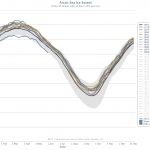
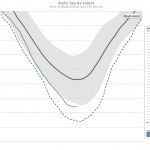
The surface ice in the Arctic has been melting to historic low levels every year for the last several years. The graph above shows the first ten years in the National Snow & Ice Data Center records, meant to indicate what Arctic Sea Ice "normally" does as it melts off during the northern warm months. The thick black line is the average over 1981-2010, and grey shaded area shows two standard deviations above and below that line. The blue line tracking along the lower end of the 2SD shaded area is the ice extent this year. During the period when sea ice is at its maximum, this year's ice…
Arctic Sea Ice extent continues to be a problem. This year, according to the National Snow and Ice Data Center, ARctic Sea ice reached its lowest extent this year on September 17th, which is about the sixth lowest extent on record, following a multi-year trend of decline. There is variation from year to year. This year's minimum was almost exactly the same as last years. With the exception of 2001, minimum extent has been below the climatalogical average every year since 1998.
Dana Nuccitelli has a post on this with excellent discussion and some nice graphics, and he has also produced a…
The Arctic Sea is covered with ice during the winter, and some of it melts off every summer. Over recent years the amount of melt has been increasing. This is the time of year we may want to look at Arctic Sea ice because by late September it has reached its annual minimum and is starting to reform.
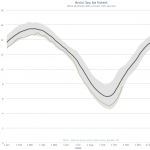
Looking at JUST surface area, which is one indicator of how warm the Arctic has become with Global Warming, we can see (above) that this years march of melting has been extreme, hugging the two standard deviation limit for all of the data from 1979 to 2010 (almost the present).
Here you can…
This is Andy Robinson of the Sea Ice Graphics
Put up or ... dump water on your head!
A new paper advances our understanding of the link between anthropogenic global warming and the apparent uptick in severe weather events we’ve been experiencing. Let’s have a look at the phenomenon and the new research.
Climate Change: The Good, The Bad, and the Ugly.
It is mostly bad. Sometimes it is ugly. I was looking at crop reports from the USDA and noticed an interesting phenomenon in Minnesota, that is repeated across much of the US this year: Fewer acres are in crops but among those acres that are planted there is a high expected per-acre yield. The higher yield will make up for the…
Lots to talk about here:
Published on Aug 1, 2014
Arctic Emergency: Scientists Speak On Melting Ice and Global Impacts (1080p HD)
This film brings you the voices of climate scientists - in their own words.
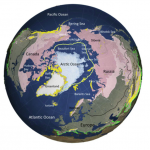
Rising temperatures in the Arctic are contributing the melting sea ice, thawing permafrost, and destabilization of a system that has been called "Earth's Air Conditioner".
Global warming is here and is impacting weather patterns, natural systems, and human life around the world - and the Arctic is central to these impacts.
-------------------------------------------------
Scientists…
As it does every summer, the Arctic Sea ice is melting off. Over the last several years, the amount of sea ice that melts by the time it hits minimum in September has generally been increasing. So, how's it doing now?
The graph above shows the 1981-2010 average plus or minus two standard deviations. Before going into more detail than that, you should look at the following graphic.
The top chart shows the march of Arctic Sea ice melt for first ten years of the baseline data set only, and the bottom chart shows the last ten years of the same data set. This tells us that the two Standard…
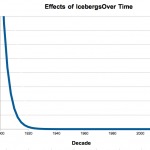
On April 14th, 1912, the RMS Titanic collided with an iceberg during her maiden voyage. The collision occurred at 11:40 PM ships time, and by 2:20 AM the ship broke apart and foundered with over a thousand people still on board. Of the 2,224 people on board just over 700 were rescued.
There have been a number of theories about the iceberg; where did it come from, why were there so many icebergs in the area at the time, how big was it, and so on. It has become general belief that the number of ice bergs in the area was exceptionally large. However, a new paper released a few minutes ago…
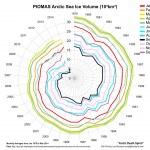
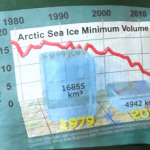
The latest, updated, Arctic Death Spiral graphic from Andy Lee Robinson ...
Earth’s northern ice cap is heating up and melting down at an alarming, not previously predicted, rate. A paper just out in Wiley Interndisciplary Reviews: Climate Change, by Josefino Comiso and Dorothy Hall looks at recent historic transformations in the Arctic using satellite imagery, mainly from 1979 to the present. The decline of Arctic ice is so extreme that ice thought to have existed for over 1450 years is melting now. (None of the sea ice is really ancient, even the “old” ice recycles over geologically short time periods. But in the near future there will be virtually no “old” ice…
I'm going to update this graph every now and then.
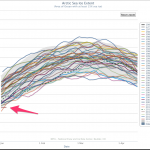
There are 12 lines on this graph.
The colorful squiggles up along the top are the first ten years of Arctic Sea ice extent for the period for which we have really good data. So this is 1979 - 1988. There is reason to believe that this is the "normal" sea ice extent track over the year from which we have seen significant deviation over recent decades.
The dark thick line is the average of all of the years from 1979 to 2010. Notice that the first ten years are all above the average except for a few little bits.
The partial line below all…