
September is when the melt of the Arctic Sea Ice stops, and the re-freeze starts. We are probably not at the minimum yet, but the amount of melting is starting to level off so we can see where we are. The above graphic, made here (go and play with the interactive graph) shows the first ten years of ice freezing and remelting in the data set to use as a baseline for comparison, and the present year. Yes, there is much less sea ice on the northern end of the planet than usual.
This version of the graph shows the years with less ice, so far, than the present year. This includes the famous 2012 when the ice melted a lot lot more than usual, instead of merely a lot more. 2007 probably had less ice than this year will see, but we can't be sure yet. 2011 and the present year are almost the same. Again, we'll see but currently 2011 had a tiny bit less sea ice extent.
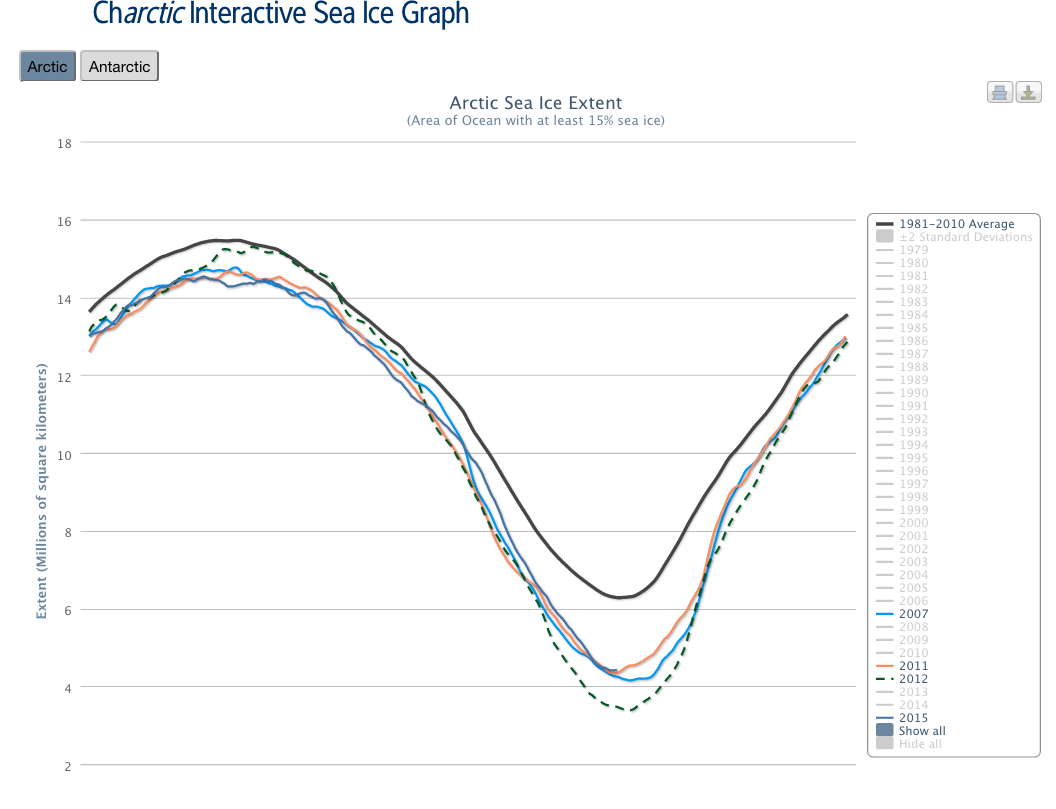
So, 2015 will end up being the second or third most ice free year on record. Keep in mind this is only surface, not volume. Still, surface is very important because it is part of a feedback system; the more surface ice the more reflection of sun's energy back into space, the less surface covered with ice, the more the Arctic sea is warmed by the sun during the summer.
Greg: Your second chart looks like the same chart as the first chart (at least on my chrome browser).
From the text I gather it should look different.
It does seem to have changed since I first viewed it. The one I recall had a dashed line... ???
Pretty pointless to track ice over a 5-year period. Earth is millions of years old. Look at larger trends. Also, south pole ice is expanding.
Mike, the data here start in 1979. !979 to the present is not five years, it is longer. You may need to get yourself a new calendar.
It is pointless to track ice in relation to the age of the Earth, which is billions, not millions, of years. That would entirely miss the point.
South pole ice is indeed doing something different. But that is pretty useless ice when it comes to the arctic. It is in the south, not the north. It does not "make up" for arctic ice.
The south pole and north pole are such utterly different situations that they can't be compared, and it turns out that the expansion of extent of sea ice in the south is both a) not the same thing at all as sea ice extent changes in the north and b) caused by ... guess what .... climate change!
So, you're kinda wrong on all points.
Mike, if you get ill and get a high fever, do you think it's appropriate to track your temperature since you were born or since you got ill?
Thomas, good analogy. Or, extended, to track the temperature of the atoms you are made of since the big bang.
Surely the point of tracking is to try and help us understand cause and effect, so that we can make informed guesses about what is likely to happen in the future - tomorrow, next week, next year, in 20 years, and to test theories to see which ones best predict the effects of particular causes.
Both charts are exactly the same, it looks like the second one is a copy/paste of the first one whereas it should be different as RickA correctly said.
Sorry, all, chart problem fixed.