#FauxPause
There wasn't a "pause" in global warming. The rate at which the plant's surface warms because of human greenhouse gas pollution varies over time. Sometimes the warming is quicker, sometimes it is slower.
There are multiple reasons for a temporary slowdown in the temerature curve, including the temperature curve being a little inaccurate, the ocean taking heat away from the surface, atmospheric dust varying over time in how much sunlight is reflected away, and so on. I recently wrote up a detailed discussion of the latest thinking on this interesting scientific problem, based mostly on a…
You've heard much about the so-called "pause" or "hiatus" in global warming.
One of the implications of a multi-year "pause" in global warming is that the science of global warming must be somehow wrong, because with CO2 rising in atmosphere, due to human activity, how can the surface not warm? However, surface temperatures have been rising, but at a somewhat slower rate than at some other times.
The truth is that there is a lot of variation in that upward trending surface temperature value, measured as an anomaly above expected temperatures. Sometimes the variation pushes the rate of…
The Problem with terminology
There is some confusion about the way we talk about global warming. Most of this confusion arises during the communication of science to the public or to policy makers. Part of this confusion rests within the science itself; There is no meaningful confusion about the nature of global warming or how it is observed, but there are some terminological glitches of the kind that arise in science all the time, and that rarely matter to the science itself.
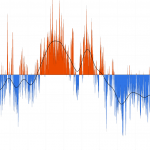
The most commonly used indicator of global warming is a graph that is meant to show the effects of global warming…
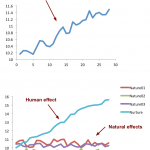
The Earth's climate is warming. The upper oceans are warming, the sea surface temperatures are elevated, the air in the lower Troposphere, where we live, is warming. This warming is caused almost entirely by the increase in human generated greenhouse gasses and the positive (not positive in a good way) feedbacks caused by that. The effects that increase the global heat imbalance and the effects that decrease it (such as greenhouse gas increase and aerosols -- dust -- from volcanoes, respectively) vary over time in their effect, which causes some variation in the upward march of global…
A paper just published in Science Magazine helps explain variation we see in the long term Carbon-pollution caused upward trend Earth's surface temperatures. The research also, and rather ominously, suggests that a recent slowdown in that trend is likely to reverse direction in the near future, causing the Earth's surface temperature to rise dramatically.
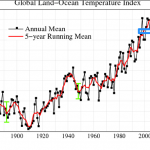
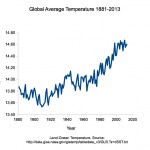
The graph shown above represents the ongoing warming of the Earth's surface owing to the increased atmospheric concentration of human generated greenhouse gas pollution, mainly CO2. But, have a look at the following graph of changes in…
In 2009 someone wrote a blog post about climate change that made all the usual science denialist claims. Hurricanes have reduced therefore global warming is not real. In this case, hurricanes are one of the main threats of climate change (a straw man) and since they are not as common these days in the Atlantic as alarmists claimed the would be (cherry picking) global warming is not a concern. There were stronger storms in the past. Katrina wasn't really all that bad. Etc. etc.
The Ice Caps (he called sea ice "Ice Caps") are not really melting that bad and besides we don't really know what…
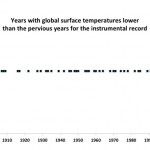
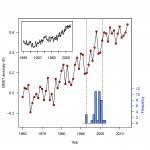
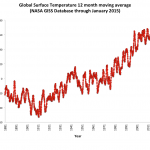
Just a quick item on the pause in global warming that is said to have happened over the last X number of years. I took NOAA's instrumental record since the late 19th century and calculated the average deviation for "surface" temperatures from a baseline for the entire period. Surface temperatures refer to the lower part of the atmosphere and sea surfaces. When you look at a graph of "global warming" expressed in temperatures, this is almost always what is meant (this leaves out a lot of things, including the poles, much of Africa, and deeper ocean waters). But it is a standard and a fairly…
The weatherologists have more or less stopped saying there might be an El Niño this year. Now they are saying there will be an El Niño, and they are starting to consider how strong it will be. Well, actually, they've stopped doing that too and are now talking about whether it will be a mondo-El Niño or a mondo-mondo-El Niño.
Here is a newly released video by Peter Sinclair and the Yale Climate Forum about the coming El Niño:
I have a prediction to make. First a bit of background.
You know about the so-called "hiatus" in global warming, because every Tea Partier with a mouth is yammering…
It is said that global warming has taken a break over the last decade or so. This is not true. Surface temperatures (air, sea surface, and ice) have increased over this period of time, though less so than previous years. Also, there are various indicators that the coming year or so may be extra warm, depending on what happens in the Pacific Ocean. Perhaps more importantly, deep sea temperatures seem to have gone up, and since most of the effects of anthropogenic global warming are seen in the ocean (over 90% of the extra heat goes there), changes in the rate of global warming at the surface…
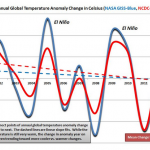
First, there is no hiatus. Climate science skeptics claim that warming stopped in 1998. It didn't. Stefan Rahmstorf has a nice post placing 2013 in context with the most recent data, HERE. Just click the "translate" button to read it in your favorite language.
UPDATE: Stefan's post is now HERE on Real Climate, in English.
Stefan has a bunch of great graphics that you will enjoy. Following his lead I've decided to make a graphic or two myself.
First, the data. NASA has this data to which people often refer when discussing global warming. I took that database and fixed it up a bit. I…