Global Warming
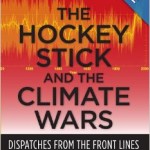
You probably already know about Michael Mann's book, "The Hockey Stick and the Climate Wars: Dispatches from the Front Lines."
The ongoing assault on climate science in the United States has never been more aggressive, more blatant, or more widely publicized than in the case of the Hockey Stick graph -- a clear and compelling visual presentation of scientific data, put together by MichaelE. Mann and his colleagues, demonstrating that global temperatures have risen in conjunction with the increase in industrialization and the use of fossil fuels. Here was an easy-to-understand graph that, in…
The fifth report of the Intergovernmental Panel on Climate Change has just come out, and Greg Laden joins us this Sunday to tell us what it means. What do over 800 representatives of 85 countries have to say about the state of consensus in scientific literature? More importantly, what do we need to do about it?
Additionally, various memes denying the science of climate change have popped up again in anticipation of this report. What might you have been hearing about climate change recently, and why is it wrong?
CLICK HERE to access the podcast.
We call it "weather whiplash." This is not just meteorologists being funny. It is a phenomenon that perhaps has always been with us to some degree, but that has recently become much more common, apparently. If you were under the impression that there is a lot of strange weather going on out there, you may be right, and weather whiplash may be the phenomenon you've noticed. Importantly, there is good reason to believe that weather whiplash is the result of anthropogenic global warming. In other words, it's your fault, so please do pay attention.
Weather patterns tend to move…
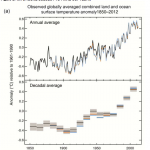
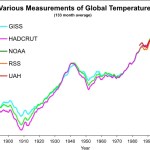
Each of these graphs from the IPCC policy summary shows the global surface temperature relative to a 1961-1990 arbitrary baseline. The upper graph shows the annual average, and thus captures a sense of variation reflecting a wide range of causes, but with a general trend from the early 20th century to the preset of increasing temperatures. The second graph shows the same data but using a decadal average. Notice that when you squint your eyes, turn your head sideways, and take some LSD you can see a highly significant decline, hiatus, pause, or even cooling in global temperatures that, if…
Eight hundred and thirty or more authors and editors representing eighty five countries wrote this thing. It is about climate change, and reflects pretty much all of the current (except the most most current of course) peer reviewed literature on climate change, with the intention of providing the basis for governmental policy related to this topic.
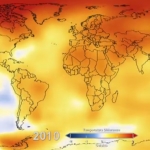
The most important conclusion of this report is that humans have caused the warming of the planet that has been observed over the last several decades. More exactly, human activity has led to both cooling and warming effects, with the net…
342
That's, like, twelve years.
So if you are 28 years old or younger, you've never experienced a cooler than average month. If you live on Earth.
Paul Douglas has the skinny:
There is a strong argument to be made that the recent flooding in Colorado is the result of global warming. Here are three things one could say about the flooding. Think of these as alternative hypotheses to explain that event:
1) Weather has extremes. Sometimes, instead of raining just a bit, it rains a hella lot and you get a big giant flood.
2) Weather has extremes etc. etc. but global warming tends to make some of the extremes more extremes, so instead of getting just a big flood, you get a big giant flood.
3) The storm that brought well over a foot of rain to one mountainous area was…
The EPA is providing free climate change related content material for middle school kids.
You can get the material HERE.
In my opinion, even though this material is aimed at middle school audiences, it is all potentially useful in high school as well depending on the class you are running. For instance, if you have a climate change related module in your 10th grade biology class, some of this material will make excellent handouts.
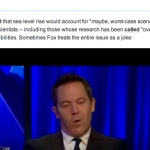
I would like to recommend an exercise, perhaps for extra credit. FOX News went apoplectic about the idea that a federal agency full of expertise on climate and…
Joe Kernen is a business finance talking head who co-hosts CNBC's Squawk Box. I don't know if he actually knows much about Wall Street, but I can prove he doesn't know squawk about Climate Science. Have a look (warning: Might make you dizzy):
Something about a low participation rate because people are getting older. But that's kind of unclear. Obviously, what is needed is a nice clear analogy from .... climate science!
So, the warmest period ever was in the 1930s when there were much lower CO2 levels. I did not know that.
Then the glaciers retreat and there are big forests. Arm…
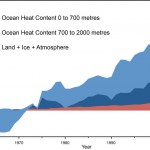
Over the last decade the surface temperatures of the earth have increased. During the previous decades, the surface temperatures of the earth increased at a somewhat higher rate. Meanwhile, over the last decade there seems to be some extra heat gain in the deeper ocean. Also, some of the surface heat is busy melting the planet's glaciers and the Arctic Sea ice. That heat does not contribute to the surface heat measurement. So, global warming has not slowed down.
This is what we know.
Here is a nice video that explains some of this from the Yale Climate Forum, made by Peter Sinclair.
Large ponderous entities like the IPCC or government agencies like NOAA take forever to make basic statements about climate change, for a variety of reasons. They are going to have to speed up their process or risk losing some relevance. Among the coming problems we anticipate with global warming will be events that have huge, widespread effects and that happen in time scales of weeks or months, or a season, and having a nice governmental report about it two years later isn't going to do anybody any good. So let's see to that problem, please (looking sternly at IPCC and NOAA).
But that's…
Most of the current models of glacial ice melting (and contribution to sea level rise) focus on ice melting and less than they need to on the process of glaciers falling apart in larger chunks such as ice bergs. Also, current understanding of glacial ice melting due to global warming indicates that the Western Antarctic Ice Sheet (WAIS) is more vulnerable to melting over coming decades or centuries than is the Eastern Antarctic Ice Sheet (EAIS). New research from two different teams seems to provide a major corrective to these assumptions.
First, about how glaciers turn into ocean water.…
Climate Scientist John Abraham and I just finished a session of FtBConscience on Climate Change and during that session we promised to provide some useful links. We also used some graphics during the session. Below are the links and the graphics!
First, here is the video of the session:
Climate Change Science Twitter List
I created a twitter list of people (or organizations) that tweet about current climate change science. If you check this list at any given moment you’ll know the latest climate science news. If you have a suggestion as to who should be added to this list, send me a tweet!…
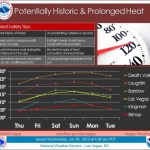
This is just a weather prediction, so it is subject to revision, but the National Weather Service is expecting an historic heatwave in the American West next week, probably peaking next weekend. Temperatures in Death Valley will approach 130 degrees F, and Las Vegas will top 115 degrees F, if predictions pan out. The heat wave may extend to the Canadian Border.
From Andrew Freedman at Climate Central:
The furnace-like heat is coming courtesy of a “stuck” weather pattern that is setting up across the U.S. and Canada. By early next week, the jet stream — a fast-moving river of air at…
No time for a meeting of the Flat Earth Society.
"I don’t have much patience for anyone who denies that this challenge is real. We don’t have time for a meeting of the Flat Earth Society. Sticking your head in the sand might make you feel safer, but it is not going to protect you from the coming storm. Ultimately we will be judges as a people and as a society and as a country on where we go from here ... push back on misinformation, speak up for the facts, broaden the circle of those who are willing to stand up for our future, convince those in power to reduce our carbon pollution … invest…

Let me 'splain.
If you want to know exactly where your dog is, you could put at GPS sensor in the middle of it's body, perhaps near the pancreas. It would give you an average position for your dog, and would be most accurate most of the time.
If you put the GPS sensor on the tip of the dog's tail, and used that to estimate where your dog is, you would be nearly wrong much of the time, even if over the long term this would be a good estimate for where your dog has been.
More importantly, if you wanted to measure the movement of your dog, the GPS sensor in the middle of the dog's body would…
NOTE: I've rewritten this post and redone the graphic. The original map on which I based the reconstruction, provided by the USGS, is distinctly different than the one the USGS provides today. The difference is, in fact, rather dramatic. In comparing the older and newer versions of the maps, I have decided to assume the later, more recent, version is more correct. I admit to being a little annoyed at the USGS providing a truly bogus map on their web site, but that is water under the bridge, as it were. So, the following post is edited a bit and a new graphic is provided. Thanks to…
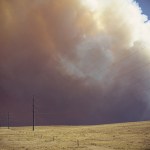
High temperatures and dry conditions have caused the outbreak, increased intensity, and rapid spread of numerous wildfires in Colorado. Again. Fires happen, but the number, size, and intensity of wildfires in the western United States has been very high in recent years, and this is caused by global warming.
Global warming causes more rain and more frequent and more severe storm lines. More rain causes more plant growth in otherwise arid regions, and severe storms knock a lot of that vegetation down. This causes more light to get to the ground, so "ladder" vegetation, which enhances fire…
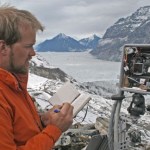
Obviously, you don't want to help melt the ice cap. But you can help scientists figure out how and why it is happening and to learn important details of what might be one of the most important effects of global warming happening right now.
First, a word on why this is important. Look out the window. If you live in Bavaria, and you look out your window, perhaps you can see fish swimming by because you are in the middle of a huge flood affecting Central Europe. Look out the window. If you live in the American Midwest, it is either raining, about to rain, or it just rained, and you might be…
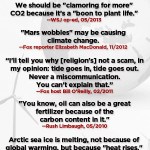
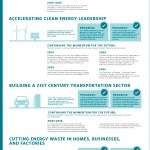
I have two items for you. First is a video produced by Media Matters on Right Wing Science. I especially love Bill Nye's facial expressions as he is assailed with unbelievable stupidity:
And now, also from Media Matters, this fun infographic. Share it around!