
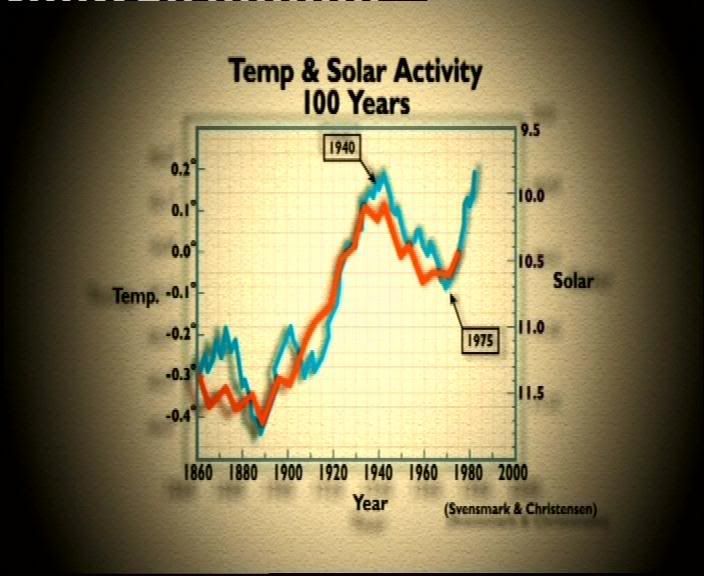
 Thanks to BG, we have a screen capture of the solar graph from the silly "Swindle" prog; I've inlined it. Now this is nice, because it says S+C as source. Which means we can look-up the ever useful Damon and Laut. First off, notice that the data plotted *isn't* solar variation directly, but an index of solar cycle length. There was speculation that it might be related to solar variation, but this was never clear. Now notice that the solar graph stops in 1980. Why could that be? Look at D+L's figure 1c: when the correct data is used, the upturn after 1980 disappears and the correlation with temperature disappears. Oops. Best not mentioned...
D+L also say (of the ): Also, the article published in 1995 by Lassen and Friis-Christensen, investigating the possible correlation of solar activity and terrestrial temperatures over the extended period of four centuries, contains unacceptable data procedures [Laut, 2003].
![): Also, the article published in 1995 by Lassen and Friis-Christensen, investigating the possible correlation of solar activity and terrestrial temperatures over the extended period of four centuries, contains unacceptable data procedures [Laut, 2003].](http://i157.photobucket.com/albums/t63/izzy_bizzy_photo/capture2.jpg)
[Update: B points out (I'd noticed this too...): 400 years of T-solar activity... is sourced to "Svensmark and Chistensen" for some reason, but is almost identical to Fig. 6(a) of Laut, which reproduces a graph from Lassen and Friis-Christenen (1995). However note that on the prog's graph the red line, plotting solar cycle length, is continuous and agrees spectacularly well with T between 1600 and 1700. This portion of the graph is missing from Laut, and for good reason, since this is the time of the Maunder minimum. Bit tricky measuring a solar cycle length when there are no sunspots! I don't have ready access to the Lassen/Friis-Christensen paper, but this seems to be the relevant graph. Again, no solar data between 1600 and 1700. Interesting!
Yes indeed. It looks like the prog has filled in the missing bits from the temperature graph :-) -W]
The Danmarks Meteorologiske Institut reported the problem in using solar cycle lengths to predict temperature.
http://web.dmi.dk/fsweb/solarterrestrial/sunclimate/welcome.shtml
The prediction goes the wrong way for recent years!
New Scientist plotted a graph using the updated data available in April 2000, ie. at least the last 7 years are missing:
http://web.dmi.dk/fsweb/soljord/solklima/TKL99fig1.jpg
and http://news.bbc.co.uk/1/hi/sci/tech/734983.stm
Surely presenting fabrication as fact on the TV contravenes the broadcasting regulations?
Cars and houses are expensive and not everyone is able to buy it. But, loans are invented to aid people in such kind of hard situations.
The hard working people should read your article close to this good post and buy the thesis report at the dissertation service.
There is no matter how hard you want to compose perfect psychology essays paper, because the famous essays writing services can do it much better. Thence, chill out and order free essays.
Opting for dissertation service and just some custom thesis, some men canât underline such supreme writing thesis just about this good topic.
Our professional essay papers services seem to be well known. It's reasonable to buy custom papers from our firm.
If you are students who have no idea how to deal with their school homework by their own hence trained jobs for writers is accessible for you at this service!
OK, so at this point someone sends a letter to channel 4 saying we are bringing this to the broadcasting authority, what you gonna do about it.
Don't they have freedom of the press in Britain?
See Section 265 of the 2003 Communications act at http://www.opsi.gov.uk/acts/acts2003/30021--i.htm#265.
Also see sections 5 and 7 of the Ofcom Broadcasting Code at http://www.ofcom.org.uk/tv/ifi/codes/bcode/.
Dave
Has anyone noticed the striking resemblance between the 2001 Danish TV documentary mentioned in D+L, and the Durkin (Channel 4) product this week? It seems that originality is in short supply in the creative denial business.
Oddly, Calder & Svensmark's book was discussed 3 weeks ago on BBC's Newsnight, but nobody even noticed. I suspect there may have been more analytical discussion in that programme, though. Kudos to Channel 4's marketing department for hitting the right buttons; the channel did its job (getting ratings); it's hard to deny them the right to broadcast contentious material, but given Durkin's track record, some of the participants might yet have something to say...
Regards,
Reading the Laut 2003 paper, I noticed something strange about the programme's graph of 400 years of T-solar activity. It is sourced to "Svensmark and Chistensen" for some reason, but is almost identical to Fig. 6(a) of Laut, which reproduces a graph from Lassen and Friis-Christenen (1995).
However note that on the prog's graph the red line, plotting solar cycle length, is continuous and agrees spectacularly well with T between 1600 and 1700. This portion of the graph is missing from Laut, and for good reason, since this is the time of the Maunder minimum. Bit tricky measuring a solar cycle length when there are no sunspots!
I don't have ready access to the Lassen/Friis-Christensen paper, but this seems to be the relevant graph. Again, no solar data between 1600 and 1700. Interesting!
I found the original data for Lassen/Friis-Christensen, and there are some entries for 1600-1700. They show very long cycle lengths, which I guess is associated with the Maunder minimum, and is probably why they weren't plotted in the original paper. It also says at the link: "Note that to 1744 the solar cycle extrema are very uncertain and non-standard." In any case, the data from 1600 to 1700 bears absolutely no resemblance to that plotted in the programme.
Unless there's a paper by Svensmark/(Friis-)Christensen I'm missing, but I thought they only wrote about cosmic-ray/cloud stuff together, and not the solar cycle length? And the rest of the graph looks too much like Lassen/Friis-Christensen not to be them. So I wonder where the programme got the 1600-1700 data from, and why it so closely matches the temperature?
Chuckle. Ain't it obvious? Since they knew the two correlated, they could just interpolate to fill the gap. It's how many gaps in evidence are filled, by using faith-based data.
Lying bastards. I wonder if we could get money to do a documentary poiting out the lies?
Carl Wunsch has made a much stronger public statement over at Real Climate:
http://www.realclimate.org/index.php/archives/2007/03/swindled-carl-wun…
Have Lassen and Friis-Christensen publish a response to Damon and Laut?
[As far as I know, no. If anyone knows better, please let me know -W]
Forget guys the forged data during the 1600s. We are dealing with models with unsknowns yet to be elucidated. But can we deny that there NO correlation in figure 7?? I would say no, we cannot.
Yes we can, or better said
a. We can find better correlations with other things, this one is really forced
b. The ideas that are invoked as causes are questionable at best. If you spoke science, I would say that the models put forward to justify the correlation are questionable to be generous.