
David Appell has a rather dramatic graph:
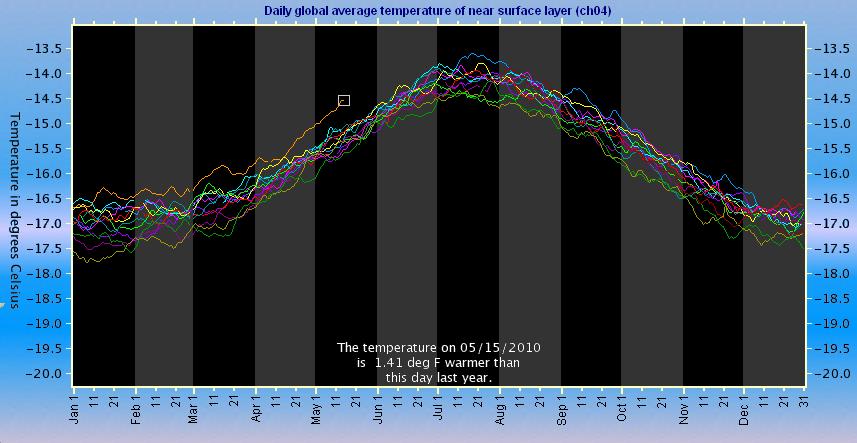
It is from Roy Spencer. As DA says: I'm sure those skeptics who pored over every detail of the sea ice this winter will be touting this picture soon :-).
[Update: BCL points me to http://bigcitylib.blogspot.com/2009/07/pielke-sr-respnds.html which again suggests problems with UAH. Well, we all know we should use RSS anyway. Hopefully they will provide the funky interface
Update: Picture post: 'hottest April ever' says Nurture -W]
Haven't heard any predictions of a coming ice age for about a year now.
Aren't the UAH guys revising their calculations? I wonder if it's just an artifact of that.
I've been wondering about this.
You'll probably get an error if you try to go directly to the "execute" link. David Appel's pointing to the "near surface" (channel 04) info.
Spencer's explanation and instructions are here:
http://www.drroyspencer.com/2009/01/daily-monitoring-of-global-average-…
That page's "website" link goes to the charting page:
http://discover.itsc.uah.edu/amsutemps/
It defaults to the view David Appel shows.
But Spencer says, pick Channel 05 (that's 14,000 foot elevation). That one starts showing 2009, 2010 and the 20-year-average.
But -- for a good time, try
-- clicking to add 20-year high and low, then redraw;
-- clicking to add all the years (since 1998), and redraw
This year's line is way outside the pack.
The years since 1998 don't span the 20-year average, but only a few charted weeks in 1999 and 2000 fall below that 20-year low record.
Caution: the display uses different colors for the years depending on which altitude data you're using. Keep the caption in any screenshots you take.
How long til we see "Welcome to Climate Wobegon, where all of our temperatures are above average."?
William, is the 1998 year in that plot? It's not obvious what we're looking at. I can count 12 lines but my eyes could be tricking me.
No predictions of an ice age? You haven't been paying attention... ;-)
Might have something to do with oceans being rather warm.
Alex, 1998 is barely visible in the image here. It's a very dark red that starts about August 1st. (No clue why. You'd have to ask Spencer.) But the 1998 line is very similar to the 2009 line after August 1st. 2009 has the highest values in the graph above.
There's a box to check on the UAH website that allows you to plot the 20-year highs from the first 20 years of the record (1979-1998): if you do that, the current temperatures don't look _quite_ so excessive, though they are still above even that mark.
-Marcus
Atmoz, thanks for the clarification. This whole thing still doesn't make much sense. I read Roy Spencer's blog and whilst I think we all know that the present year is a hot year he hasn't otherwise been reporting super super high temperatures for this year, and no one else has either. See, e.g., http://www.drroyspencer.com/2010/05/april-2010-uah-global-temperature-u…. This new plot, wherever it came from, would suggest that the 2010 year has been hotter on average, and by a long way, for every day since January 11. This must surely be some kind of mistake.
I'm hoping for a bug too.
Otherwise even if it's short-lived it's, well, scary. ENSO has faded in the last few weeks and yet the curve has bent in the wrong direction!
I suppose there could be some other anomaly at work. Cloud or vapor anomalies would seem to be the only candidates, and on this global scale it would still amount to something very big needing a mechanistic explanation. Just nodding in the direction of "variability" won't pass muster.
Is this Trenberth's missing heat come back to haunt us?
mt
at http://climatephysicsforums.com/topic/3340735/1/
"SkyHunter" suggests "Tropospheric temperatures lag surface temperatures. The Jan-April period is the warmest on record. Expect to see high temps for the lower troposphere for the next few months."
I had thought the radiative equilibration e-folding time of the troposphere was shorter (two weeks?), but maybe I am out of date on that number?
[As it ahppens I'm interested in that, cos I'm just adding fiddly bits to http://en.wikipedia.org/wiki/Greenhouse_effect - last bullet point, "basic mechanism" section. Feel free to assist :-) -W]
Some quick notes:
a) Appell's figure is ch 04. You really should be looking at ch 05. Ch 05 is the next layer up, is the basis for LT, and is also running warm, but not quite as warm as ch 04. Ch 04 is *not* necessarily a reliable indicator of surface or near surface temperature.
[I did subsequently try ch 05 too. But it doesn't look much different -W]
b) The referenced website shows one satellite's AMSU's raw data, a satellite that happens to have started in August 1998.
c) AFAIK, 2010 is the warmest ever in the satelite record since super El Nino of 1998. But that had already peaked before the start of the raw satellite record in August 1998. So you would expect to see records in the raw data for early 2010.
d) Satellite tropospheric record is more volaitle and sensitive to ENSO than the surface record, so you would expect greater increase over last year in the satellite record. Already UAH limear trend has gone from 0.13C to 0.15C (since 1979) in just a few months.
e) The absolute temperature does rise through the year, since the globe overall is warmer in NH summer than SH summer. That's why all the curves rise in parallel at this time of year.
Also there are a lot of adjustments that need to be made to the raw data to produce the final LT UAH and RSS time series. Those adjustments are necessary to account for diurnal drift/orbital decay, as well as different "hot points" on different satellites' AMSU units.
I don't think the ch 05 raw data is way out of line given all of that. But I would note there is a mild annual cycle in both UAH and RSS (UAH used to be much worse).
See:
http://deepclimate.org/2010/03/08/a-first-look-at-uah-5-3/
What *may* be happening is that the raw data is running somewhat warmer than the adjusted data, because the annual cycle in UAH and RSS still boosts slightly in Jan/Feb relative to, say, April or May.
[That is quite likely the best explanation. Which is why at this point I think the pic is just interesting -W]
If the lag between temperature and ENSO indices bears out as in the past, we should probably have reached the global temperature peak (in terms of monthly anomaly). I guess the May and June figures will tell the tale.
DC: "What *may* be happening is that the raw data is running somewhat warmer than the adjusted data"... I'd think the same thing. But wait a second: So while "correcting" they're "cooling" - and McIntyre hasn't picked that up yet?? Funny how the "auditing" business seems to work.
These high UAH readings date from summer of 2009. I asked Pielke Sr. about it, and he asked Spencer:
"Thanks for alerting me to your weblog. I contacted them [UAH], and
they reported there is a drift in the part of the diurnal cycle that
the AMSU sensor samples. I have urged them to write a weblog on this
issue to clarify as all of us are comparing with their long term
average."
Pielke Jr. made a note of this back around the same time last year, something about the "global cooling" meme about to be retired.
Actually, here's the link to the rest of Pielke Sr.s response:
http://bigcitylib.blogspot.com/2009/07/pielke-sr-respnds.html
#13 does seem to confirm that you can't argue directly from raw to processed data - there are numerous adjustments as I noted in #11.
And that also relates to two more important points that should be mentioned:
1) Each raw channel data shows a wide swathe - it is not narrowly focused on a layer of interest. That's why LT processing of ch 05 involves procedures to remove the stratospheric influence.
2) As far as I know the particular satellite shown is not actually used currently in the UAH product. I'm not sure about RSS, but I suspect it too does not use it.
Bottom line: this is a very complex data set and it takes more than just eyeballing the raw data of one satellite in one channel (that isn't even used for further analysis) to understand it.
Spencer notes the near-parity in his data between first parts of 2010 and 1998 and says "the recent global tropospheric warmth associated with the current El Nino has been about the same as that during the peak warmth of the 1997-98 El Nino."
http://www.drroyspencer.com/2010/05/april-2010-uah-global-temperature-u…
He somehow fails to note that the current El Nino is unexceptional while 1998 was huge.
What *may* be happening is that the raw data is running somewhat warmer than the adjusted data, because the annual cycle in UAH and RSS still boosts slightly in Jan/Feb relative to, say, April or May.
[That is quite likely the best explanation. Which is why at this point I think the pic is just interesting -W]
I hasten to add that is difficult to disentangle the adjustments from the residual annual cycle, because any spurious annual cycles are actually introduced in the adjustment process.
If you look at the link I gave above, you'll see large differences in the monthly values between UAH 5.2 and UAH 5.3, which has a smaller annual cycle. But the overall long term trend remained the same. You have to take the specific monthly values in UAH and RSS with a grain of salt.
It also makes it difficult to use the tropospheric record to detect and analyze differences in seasonal warming trends. The surface record is much more reliable for that, and in other ways too, I would say.
OT
concerning:
http://scienceblogs.com/stoat/2010/04/flat_earth.php
now they can insert this valuable unknown data into the models:
http://news.yahoo.com/s/livescience/20100519/sc_livescience/oceansdepth…
i imagine it is hard to track global energy with that "unkown" lurking as an assumption up till now?
back to the satellites
>"What *may* be happening is that the raw data is running somewhat warmer than the adjusted data, because the annual cycle in UAH and RSS still boosts slightly in Jan/Feb relative to, say, April or May."
You can of course click on the show data as text and open
discover.itsc.uah.edu/amsutemps/data/amsu_daily_85N85S_ch05.r002.txt
in your favourite spreadsheet and calculate some monthly averages.
According to the figures from used for those graphs
Jan 10 is .39C warmer than Jan 09
Feb 10 is .37C warmer than Feb 09
Mar 10 is .5C warmer than Mar 10
Apr 10 is .38C warmer than Apr 09
Per http://vortex.nsstc.uah.edu/data/msu/t2lt/uahncdc.lt
This Lt product is a processed to exclude stratosphere
Jan 10 is .39C warmer than Jan 09
Feb 10 is .35C warmer than Feb 09
Mar 10 is .47C warmer than Mar 10
Apr 10 is .34C warmer than Apr 09
A largest difference between the two versions of .04C seems close enough to negligable to me rather than reaching a 'running somewhat warmer' level.
#19
Actually, I had more in mind an (albeit reduced in UAH 5.3) annual cycle in recent years with respect to the 20-year baseline. There is good evidence this annual cycle was at least 0.2C per year peak (Jan or Feb) to trough (May or June) in UAH 5.2. Now it may be down to 0.1C or less.
In retrospect I probably should have said "slightly warmer" rather than "somewhat warmer". The difference between the anomalies for Jan 2010 and Apr 2010 in UAH LT 5.3 is 0.14C (0.64C vs 0.50C). The raw AMSU set shows 0.08C (0.66C vs. 0.58C from 20 yr baseline). So now we're up to 0.06C discrepancy - still not very much, but we are not at trough yet.
On the other hand, the AMSU at the website is not even the one that UAH uses, so these comparisons of raw to adjusted may not mean much anyway.
But I do concede the effect is not that big. And overall I would agree that this closer to a molehill than a mountain. Which was where I started ...
Now something else to chase down. Apparently Spencer announced a satellite-based surface record at Heartland. I suppose there must be a paper on that?
Maybe ch 04 is finally being used after all!
Temperatures strangely high? That's only half the story. Sea ice levels have gone from tickling the nethers of the 1979-2000 average to patting the head - Benny Hill-like - of the 2007 outlier in less than three months. This could be the year when watching ice melt is more exciting than it sounds.
I've been looking at the typical temperature response in warm or cool ENSO years by plotting the annual cycle for years with a similar ENSO phase together (with correction for long term warming trend). Typicaly for an El Nino the temperature increase is fairly rapid with November being quite close to average and January typically being the peak, with a gradual decrease after that. 1998 went significantly higher in Feb and Apr, and 2010 seems also to be showing an extended peak well past January.
A plot of years going from cold warm to cool suggests that the cooling is quite rapid, but a little less abrupt, starting from October and bottoming in January. Also odd is that most years have had a slight increase around late NH summer before the main drop in temps. Perhaps this is a fluke due to my small sample size of five years, with 98 being the one exception to this pattern.
This could be the year when watching ice melt is more exciting than it sounds.
I recommend a regular look at the MODIS Rapid Response Teams Arctic mosaic. There's a new one every day, and if today's is not yet complete (lots of empty spaces) then page back a day. The 1km/pixel view is breathtaking. There's a lot going on at the moment, and the comparison with the Cryosphere Today/Bremen ice maps is very interesting. Areas with very high % ice area/extent on the CT mapping look very different when you look down from on high...
Having not watched at the same time last year, I can't say whether this year is in any way different, but the Arctic Ocean ice appears much more mobile and fractured than I'd expected.
Gareth, as you probably know the Catlin team reported unusually thin ice at the NP.
Back to the graph, my impression is that it's fine for an eyeball comparison for its instrument's period of record. When you add in the 20-year highs you're getting MSU data prior to August 1998, and I suspect that the maximum line represents mostly 1998 for January-July. Looking at Spencer's actual TLT product (on his blog), it's apparent that 1998 gets a relative upward adjustment such that its El Nino spike is a bit higher than this year. I'd be suspicious of that were it not for the fact that RSS shows the same thing. The upshot seems to be that it's not clear yet whether the sat records will show 2010 as a new high even though that already seems likely for both GISS and NOAA (but maybe not HadCRUT).
#21
Just two weeks ago, I covered the ravings of the National Post's Lawrence Solomon about the late winter arctic sea ice peak, and said this:
Iâll end with the âliveâ versions of both the IARC-JAXA and NSIDC Arctic sea ice charts. And Iâll return from time to time with an update to see how well Solomonâs fearless assertions about the failure of sea ice models have stood up. Chances are, theyâll have melted away by the end of summer, if not sooner.
Indeed. In fact, it appears we are witnessing the fastest spring melt in recent years. The silence in the septic (tm Stoat) blogosphere is deafening.
http://deepclimate.org/2010/05/05/national-posts-lawrence-solomon-touts…
#24
The upshot seems to be that it's not clear yet whether the sat records will show 2010 as a new high even though that already seems likely for both GISS and NOAA (but maybe not HadCRUT).
That's an interesting issue. At the 1998 El Nino peak, the satellite temp anomalies were well above the surface, IIRC. This time they are not.
It could that the troposphere is more sensitive to ENSO per se, and the current El Nino, while strong, is nowhere near the 1998 level.
It's also worth noting that today the long term trends of RSS and UAH LT are much closer than they were four years ago (as seen in IPCC AR4). The difference is less than 0.2C per decade now (0.16C/dec RSS, 0.14C UAH), and was 0.7C back then (0.19C/dec RSS, 0.12C UAH).
Comments on the graph:
First, although this satellite data is not from the satellite that the UAH anomaly is calculated from, it does give a pretty comparative indication of where 2010 stands as compared to prior years.
The first part of 1998 isn't available on this display, but as others have noted, the 1998 numbers show up as the first seven months of the calendar year on the 20 year high graph, so if you select the 20 year high option, the 2010 data can be compared to 1998. From that, it appears that May 2010 is going to give May 1998 a run for the money as the highest May anomaly in the UAH data.
The UAH anomaly is in total disarray, as Spencer and Christy try to fix their broken temperature calculation system to repair the strange cyclic pattern where the UAH showed seasonally high data in January and February, and strange low anomalies in May and June. They seem to have identified the cause for this, and reportedly fixed it in the current version.
This release substantially changed the monthly anomalies going back to 1998 and beyond, and a lot of data on the net has been orphaned as a result. For example, woodfortrees has simply added the new revised monthly UAH data to the old database, so now the information from that site on UAH is completely wrong.
As part of the adjustment, the UAH anomalies for this past January through March, have been seasonally lowered, resulting in a corresponding "baked-in" upward adjustment coming for May and June. For this reason, May and June 2010 could break the May 98 and Jun 98 highs for those months.
The most intelligent data to follow is the longer term moving averages. In this case, the GISTEMP 12 month moving average just set a new all-time high in April. The UAH team reports a 13 month moving average, and the current 13 month average trails only 1998. By the time July 2010 reports, the UAH 13 month average has a reasonable shot at displacing the 98 average as the hottest "year" in the record. So both GISTEMP and UAH seem to be setting up to show 2010 as the hottest year in the instrumental record.
Hopefully, Spencer and Christy will get their acts together, and get the UAH data fixed soon.
#27
Yes 12-month rolling average (no idea why Spencer uses 13-months, by the way) will eliminate any annual cycle problems, and is a good way of evaluating the "record" year.
[Because you can't do a centered 12-month rolling average, owing to 12 being even -W]
As far as I can tell (comparing UAH 5.2 to 5.3), the latest change kicks in in the last half of 1998, which saw the changeover from the older MSU to new AMSU sensors on the newer satellites. Before mid-1998 there are no changes at all.
I graphed the differences here:
http://deepclimate.files.wordpress.com/2010/03/uah-verrsion-comp-annual…
I'm not sure where the peak 12-month UAH period is in 1997-1998, but it probably wouldn't show much difference between UAH 5.2 and 5.3.
The odd warming was noted long ago here:
http://tamino.wordpress.com/2008/11/02/amsu-mystery/
"Indeed. In fact, it appears we are witnessing the fastest spring melt in recent years. The silence in the septic (tm Stoat) blogosphere is deafening."
There's never silence among the denialosphere. They're just focusing on other things, like the Arctic being warm in 1938 (sea ice extent is no longer important), referencing a graph from everyone's favorite tobacco lobbyist at junkscience.com.
http://wotsupwiththat.wordpress.com/2010/05/19/wuwt-arctic-sea-ice-news…
http://www.junkscience.com/MSU_Temps/Arctic1880-2004_2.gif
Not surprisingly, the graph ends at 2004, a relatively cool Arctic year. There were some off the chart warm Arctic years after that left previous years in the dust (64-90N). It claims to get the data from:
http://data.giss.nasa.gov/gistemp/tabledata/ZonAnn.Ts.txt
but the graph (along with the additional doctoring and funny commentary) doesn't quite match (could only be a raw anomaly value difference).
Also, If I'm reading that right, the data only represents land temperatures in the Arctic, which is a fairly limited area. This junkscience move I'm sure is by design, since the Land-Ocean data linked from GISS shows the 1938 value falling short of 2003. Every single year from 2005-2009 was warmer.
http://data.giss.nasa.gov/gistemp/tabledata/ZonAnn.Ts+dSST.txt
#29
I'd forgotten about that ...
If you compare 2010 raw AMSU data to last year or to the baseline, it doesn't look that far off (as we've knocked about).
But if you compare to later to earlier years in the 2000s, it makes little sense. That's where (apparently) the adjustments for orbital decay and the like are crucial.
For instance the raw data (thanks Crandles), shows Jan 2008 a full 0.3C warmer than Jan 2000. Yet in the LT record, the 2008 value is -0.20C, and 2000 was -0.24C, a difference of only 0.04C.
Apparently ch04 has even more spurious warming relative to the early years.
Yes, the picture shows record or near-record warming; May may well be UAH record or near. But much of the spaghetti of the earlier years in the 2000s is too low in relation.
No bugs; no smoking gun against UAH.
Have we done enough on this? Probably.
I'm not sure, either, but since his two periods of choice are 13 months and 25 months I would guess it's to not match up exactly with any annual or seasonal cycles. I wonder if it makes much difference.
Just be grateful it's a moving average, and not a 5th-order polynomial fit, or whatever nonsense we've seen there before. Even recently I think I've seen quadratic fits over there, in places where it doesn't make any sense.
#33
Just be grateful it's a moving average, and not a 5th-order polynomial fit, or whatever nonsense we've seen there before.
... covered in excruciating detail here.
http://deepclimate.org/2009/04/09/the-alberta-oil-boys-network-spins-gl…
I sometimes wonder if anyone showed that post to Spencer.
temperature of a surface, temperature of a volume, what's the difference?
http://psc.apl.washington.edu/ArcticSeaiceVolume/images/BPIOMASIceVolum…
I suppose the other question is, what if these temperature results are real and continue? Is that well outside the range of expected increase, or just near the upper bound?
>"I suppose the other question is, what if these temperature results are real and continue? Is that well outside the range of expected increase, or just near the upper bound?"
I have attempted a multiple linear regression to estimate UAH monthly T2lt figures based on date, ONI with lags up to 8 months, AO, wild volcanic estimates and monthly effects(now pretty small). The recent anomalies I get are:
Jul 09 +0.197C Aug -0.006C Sep +0.220C Oct +0.082C Nov +0.195C Dec -0.002C Jan10 +0.183C Feb +0.119C Mar +0.138C for a total of +1.126C Apr 2010 -0.126C.
This is not an unprecedented level of positive anomalies. For example Jul 01- Nov 02 had anomalies of 0.041 0.180 0.019 0.088 0.080 0.118 0.110 0.146 0.178 0.162 0.271 0.190 0.109 0.062 0.077 0.002 0.087 for a total of 1.921C.
1998, 1990/91 and 1978-1981 also had more significant runs of positive anomalies.
So the temperatures appear higher than what would be expected from this MR analysis but not to the extent of being above what could occur.
The periods do not appear to support suggesting that UAH t2lt is more sensitive to strong ONI effects than linear regression would support. End effects on the linear regression would seem to be a better explanation or it could just be random or unattributed effects.
Meant to add the RMSE is .126C and I am no expert and could easily have got it hopelessly wrong.
On arctic sea ice will you be challenging Patrick Lockerby to a bet
see http://www.scientificblogging.com/chatter_box/arctic_ice_may_2010
or
http://www.scientificblogging.com/chatter_box/global_cooling_beyond_par…
2010:
Many hottest weather records are broken in northern hemisphere.
Summer arctic ice at record low in extent.
By September the Arctic Ocean is freely navigable by both the northern sea route and the north west passage.
2011:
Reduced ice cover affects sea temperatures, in turn affecting Arctic current flows and air movements. Thinner ice, instead of piling up as pressure ridges due to compression effects, cracks into sections due to tension and agitation effects.
The Arctic is virtually ice-free by late summer: there is open water at the North Pole.
It could be tricky to bet on low see ice this year because the volcanic aerosols can take some effect on solar transmission ratio. If you compare daily SO2 images at the OMI Sulfur Dioxide Group website for Kamchatka, June, 2009 (it is Vulkan Sarycheva) with Iceland, April and May, 2010, you can see the quantities of sulfur dioxide gas are similar (with maxima at some 20 DU). Because the 2009 eruption was probably a good enough to cause some small irradiance anomaly (but preliminary values) it can not be ruled out for this year too (thanks the low solar elevations in the Arctic Ocean). See Mauna Loa apparent transmisison ( http://www.esrl.noaa.gov/gmd/grad/mloapt.html ) for the small summer 2009 irradiance anomaly.
I previously wrote
"A largest difference between the two versions of .04C seems close enough to negligable to me rather than reaching a 'running somewhat warmer' level."
Perhaps I spoke too soon. May data has just released on Roy Spencers Blog: May raw data .53C warmer than 2009, adjusted data .39C warmer than 2009 which gives a difference of .14C
So Jan 0.0C Feb 0.02C Mar 0.03C Apr 0.04C May 0.14C
makes the trend in raw data running warmer than adjusted data look rather more alarming.
However:
Deep Climates analysis updated:
Jan - May Lt2 5.3 .648 - .534 = .114
Jan - May raw AMSU (comparing to 20 year avg) .662 - .646 = .016
Difference .098C
So .08C difference from last time has grown to .1C. I presume that is much as expected as we are nearer the trough now.