
 Some flaw in the over-eager Sb security, or more likely an intermediate layer, locked me out over the weekend, so my apologies for any delayed approvals and so on. One of which was to a reference to Estimating economic damage from climate change in the United States by Solomon Hsiang et al., Science 30 Jun 2017, Vol. 356, Issue 6345, pp. 1362-1369, DOI: 10.1126/science.aal4369. Which says:
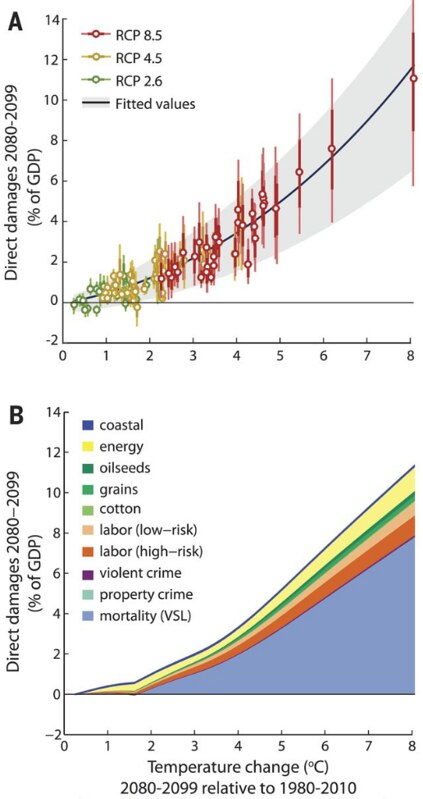
Estimates of climate change damage are central to the design of climate policies. Here, we develop a flexible architecture for computing damages that integrates climate science, econometric analyses, and process models. We use this approach to construct spatially explicit, probabilistic, and empirically derived estimates of economic damage in the United States from climate change. The combined value of market and nonmarket damage across analyzed sectors—agriculture, crime, coastal storms, energy, human mortality, and labor—increases quadratically in global mean temperature, costing roughly 1.2% of gross domestic product per +1°C on average. Importantly, risk is distributed unequally across locations, generating a large transfer of value northward and westward that increases economic inequality. By the late 21st century, the poorest third of counties are projected to experience damages between 2 and 20% of county income (90% chance) under business-as-usual emissions (Representative Concentration Pathway 8.5).
I haven't read it yet, having just got into work... ahem. Anyway, you'll notice that the damages are broken down by area and (surprisingly, to me) a large portion is due to "mortality". The associated discussion just says These results are not without caveats. Hsiang et al. appropriately focus much attention on quantifying uncertainty in the estimates. Yet key parameters are fixed, including the value associated with mortality consequences (which drives one-half to two-thirds of the estimated damages) (my bold). The paper says Rising mortality in hot locations more than offsets reductions in cool regions, so annual national mortality rates rise ∼5.4 (±0.5) deaths per 100,000 per °C (Fig. 3C). For lower GMST changes, this is driven by mortality between ages 1 and 44 and by infant mortality and ages ≥45 for larger GMST increases (fig. S13 and table S12). And, yes, there is politics involved, just as there was when there was all that fuss over the IPCC valuing Brown Lives Less some while ago: It is possible to use alternative approaches to valuing mortality in which the loss of lives for older and/or low-income individuals are assigned lower value than those of younger and/or high-income individuals (44), an adjustment that would alter damages differently for different levels of warming based on the age and income profile of affected individuals (e.g., fig. S13). Here, we focus on the approach legally adopted by the U.S. government for environmental cost-benefit analysis, in which the lives of all individuals are valued equally.
Actually, thinking about this while making a coffee, just using "the approach legally adopted by the U.S. government" and not using "the best", or at least trying alternatives, is weird.
Refs
* fight-entropy.com - SH's joint blog
* The funding fallacy
* How Deaf Schizophrenics Hear Voices - DA
Grr:
"By the late 21st century, the poorest third of counties are projected to experience damages between 2 and 20% of county income (90% chance) under business-as-usual emissions (Representative Concentration Pathway 8.5)."
RCP 8.5 isn't going to happen. We've already done much of what is necessary to stop it happening - making solar cheap etc. It's just not BAU any more.
So, how may unnecessary/avoidable deaths of poor people in the USA per degree does this work out as? How close to a genocidal number would this be?
Allowing avoidable harm to come to others through inaction is already a crime, not so sure about putting people at unreasonable risk.
Interested to know how this compares to Stern, which was much darker.
Tim,
I do think you have to be slightly careful of writing off RCP8.5, at least in the sense of it being a concentration pathway (rather than an emission pathway). Technically, it is a concentration pathway that leads to a change in forcing (by 2100) of 8.5W/m^2. There are carbon cycle uncertainties that mean that we could follow a lower emission pathway but still end up with a concentration pathway that produces a change in forcing of 8.5W/m^2 by 2100.
Having said that, I agree that it has got much less likely and I fully expect that we will not follow an emission pathway that would lead to a change in forcing of 8.5W/m^2 by 2100 (because that would be very stupid). However, I'm not convinced that we're yet at the stage where we can claim that it is no longer possible.
It's unfortunate people keep referring to RCP8.5 as "business as usual". It gives the impression of just increasing emissions from fossil fuels as time progresses, but this is not the case. The relative contribution of fossil fuels to the energy/electricity generation in the RCP8.5 scenario is going down from about 2050/2060 onward. That is, the RCP8.5 scenario includes an increasing use of alternative energy sources.
Ah, once again into the RCP 8.5 merry go round.
The 8.5 was given as the total to the researchers. The researchers were tasked with calculating intermediate levels as inputs to climate models. They were later asked if they could come up with a plausible narrative explaining how the total could be reached. So far they have said they're still working on it.
RCP 8.5 isn't a business as usual projection. That's because it's not a projection. It's not a prediction.
The early attempts at a narrative explaining it as a pathway have already been invalidated.
But ooooh, it's scary.
"Sb security"? Why do you require protection from antimony?
"It is possible to use alternative approaches to valuing mortality in which the loss of lives for older and/or low-income individuals are assigned lower value than those of younger and/or high-income individuals (44)"
I'd split this into 2 parts: I _do_ believe that in an ideal world we should generally move towards some kind of "QALY" (quality-adjusted-life-years-lost), where killing off a healthy 20-year old is worse than killing off a bed-ridden 90-year old. However, an additional year of life for a 90-year old might be worth more than an additional year of life for a 20-year old, so there are some non-linearities.
But for poor people, I think that caution needs to be taken. If the policy choice is, "do we give a community 1 million dollars, or do we spend 1 million dollars on preventing pollution that would avoid a statistical death in that community" - well, then, the income of that community matters. If the community is rich, obviously, they'll prefer the pollution control, if the community is dirt poor, they'll prefer the cold hard cash (which may be used to save more than one life!). But generally, the choice seems to be, "do we spend 1 million on preventing pollution that would avoid a statistical death in community A, or do let community B keep that 1 million dollars" where generally community A is poor, and community B is rich investors: well, then saying that because community A is poor, they should be valued less, is a completely different issue. (there's the 3rd factor of "should we value a high-income individual more because they contribute more to society"... the extent to which this matters depends on the value of a default human life. If a life is worth a lot to begin with, then the marginal benefit of being a "high-contributor" won't make much of a difference).
On RCP8.5 and its BAU-nature: I looked for but could not find an update to the Webster et al. analysis in 2012 (https://link.springer.com/article/10.1007%2Fs10584-011-0260-0?LI=true), as I think this is the right kind of approach to answering this question. At that point, the authors looked at the median scenario from the probabilistic analysis and determined it was fairly similar to RCP8.5 (which was under development at that time). But I'd like to see an update to that paper, as well results from a 2nd research group that asks the same question.