
When you pour a beer, there is this foamy top called the head. The size of the head decreases over time. What is this process dependent on? Clearly, little bubbles of beer are popping. Does each bubble have an equal probability of popping? Do only the bubbles on the top (or bottom) pop? I became aware of this idea from a colleague. Maybe he was going to do an analysis, but I haven’t seen it yet. If you do (Gerard), I am sorry for doing this before you. This may have been investigated before, but in the spirit of re-doing everything I have not searched for previous beer head studies.
Note: if you are a high schooler or a teetotaler, you could probably repeat this with Dr. Pepper or something. If you are underage, don’t drink beer – it’s disgusting. If you are over 21, beer is awesome.
So, here is the plan. See if I can model what the head size would do over time if the each bubble has an equal chance of popping. I will also model what would happen if just the top bubbles had and equal chance of popping.
Suppose the foam is made of bubbles and each bubble has the same chance of popping (and thus turning to pure beer). Maybe I should start with a diagram.
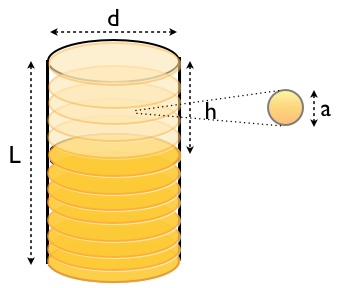
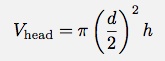
Here you can see the dimensions of the head, and thus get the volume. Also, I tried to represent an individual “beer bubble”. If the bubbles are of uniform size (probably not exactly true), then the volume of the head is proportional to the number of bubbles. Also, for this glass, the head is the shape of a cylinder. This is important because it will let me relate (easily) the change in volume with the change in height.
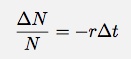
Ok, I think I am ready to begin. Let me determine a model for the height of the head as a function of time if each bubble has an equal chance of popping. This is very similar to radioactive decay (so I will use similar notation). Suppose the rate at which a bubble will pop is r. Also suppose that there are N bubbles. Suppose I had no nose, then how could I smell a rose? (Dr. Suess) So, in a short time (?t) how many bubbles will pop? Well, the probability that one of the bubbles will pop will be:
![]()
The number of pops in that short time will be the probability of one popping times the number of bubbles.
![]()
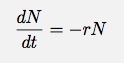
The number of bubbles that pops reduce the number of bubbles. I can then write the change in the number of bubbles as:
![]()
Now, I can get all the “N” stuff on one side of the equation and all the “t” stuff on the other.
As the time interval gets really small, I can write this in differential form:
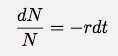
I really need to add some posts about derivatives and integrals, but I am going to proceed. If I integrate both sides, I can get an expression relating N and t.
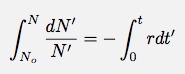
Notice that I am trying to be a good integral-boy. I have my limits of integration variables different than the variables in the functions. That would just be awkward. (again, I will talk about integration in the future – if I forget, remind me) After integrating, I get:
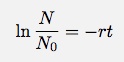
Physicists always like to write the natural log (ln) of a quantity without units. It makes more sense that way. If I want N as a function of time, I can write the expression as:
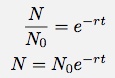
This is the classic exponential decay equation. Note that r has units of 1/sec. This makes rt unitless – a good thing for exponentials. Ok – remember the goal, I want to get a function of the height in time. If each bubble has an equal chance of popping, I have the number of bubbles as a function of time. If all the bubbles are the same size, this would be proportional to the volume. First to get a relationship between the number of bubbles and the volume of the head. Each bubble has a volume:
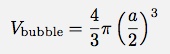
Note: I have no idea what the dimensions of the bubble are. I have just called the diameter “a”. Now for the volume of the head.
If I assume that all of these bubbles fit perfectly in the volume of the head (clearly not true, but it doesn’t really matter – I can pretend like the space each bubble takes up is a cube of volume a3 – that would be a better idea). This means that in the head, there are:
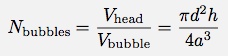
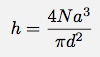
I guess I don’t need the “bubbles” subscript on the N variable. I really want h as a function of time. Solving this for h gives:
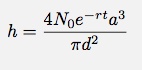
Now I can plug in the time dependence of N.
However, I don’t really know N0, but I do know the initial height. If I use the relationship for N that relates to volume:
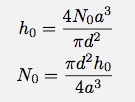
Now, I can put this in for my expression and get h in terms of h0 and t:
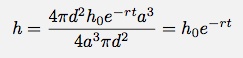
Now, this is something I can test. I don’t know the constant r, but that can be determined from the data (perhaps). Before I explore other models for bubble-popping, let me see if the data agrees with this model. Here is the video.
Beer head from Rhett Allain on Vimeo.
BUT WAIT! Don’t watch that video. It is long and boring. I only put it there so that you could use it to collect your own data if you so choose. Or, perhaps you like sitting around watching the grass grow. If that is the case, this should be awesome.
I used my favorite FREE video analysis tool – Tracker Video. I took the data from the analysis and plotted it with Logger Pro (it is not the best, but it is quick – and I really wanted to drink that beer) – also, it is not free. I plotted the y position of the top of the head, the y value of the bottom and the value of the height. If you DID accidentally watch that video, you would notice that the bottom of the head moves up as more of the bubbles are turned into beer.
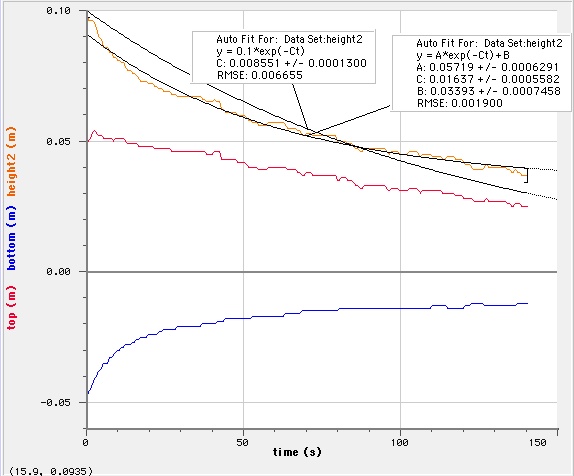
In this graph, I fit two functions to the data (well, Logger Pro did). The first function is:
![]()
This function seems to fit the data ok, but it has the linear constant added on. In my derivation above, I did not have such a constant. Note that I left off the units so it would be quicker to write.
The other fit gives:
![]()
For this second fit, I told Logger Pro to keep the coefficient out front as 0.1 (because that was the height at t=0 seconds). I also told it to not use a linear constant added to the function. It doesn’t look like it fits as well. Here is one final fit. In this fit, I allowed Logger Pro to chose everything but I said “no linear constant”.
None of these fits seems just right. One way to compare the three fits is with the “root mean square error” (RMSE). Logger Pro reports this value with its fits. It is basically a measure of how far the data points are from the function that I am fitting. Lower values are better. Here are the three functions that I fit with their RMSE values.
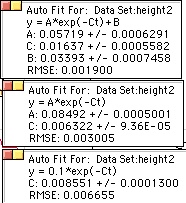
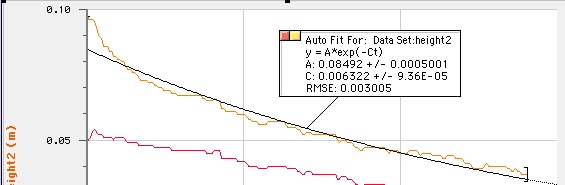
The fit with the constant added on (B) has the lowest RMSE. Let me try refitting the data while not including the first few seconds of data. If you watched the video, things change fast during this time. Also, the head is somewhat difficult to measure.
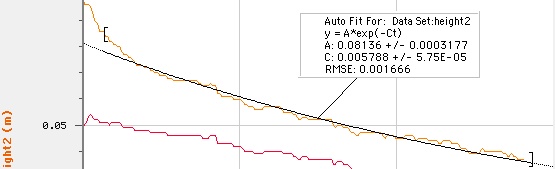
I guess this isn’t too conclusive. It fits better (with RMSE = 0.0017), but a straight line fits ok to that data also.
What about the idea that only the bubbles on the top pop (or that these are much more likely to pop). The first problem is “how many bubles are on the surface?” This question depends on the bubble size. If each bubble takes up a cube of space of size a, then the number of bubbles on the top is:
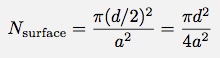
Note that this number does not depend on the height, but it will effect the height (as bubbles pop, the height goes down). Suppose that each one of these (on the surface) had an equal chance of popping. I can’t really write an expression for the number of bubbles on the surface because if a bubble on the surface pops, another one takes its place. The number of bubbles on the surface is essentially a constant. But (in this case), the rate of change of ALL the bubbles would be the rate of change of the bubbles on the surface. If I go back to the expression I derive regarding the rate of change of the number of bubbles, I had this:
Before, N was a variable. But in this case, N is the number of bubbles on the surface and thus a constant. This means that the rate of change of the number of bubbles is a constant. This would make the volume change at a constant rate and therefore the height would change at a constant rate (since it is a cylinder). Does a straight line fit the data? It fits somewhat ok for the later times, but it clearly does not fit the early times. Of course, I said I had trouble measuring the head at the beginning anyway.
What other possible ways could the bubbles pop? Maybe the bubbles on the top and side only pop (or maybe the bottom also). I will leave this as an exercise for the readers. I think the problem is that I need more and better data. You know what that means.
Update:
Commenter Alex pointed out that this has been done before. He is correct. I found two older papers that look at the head of a beer.
- A Leike, “Demonstration of the exponential decay law using beer froth” European Journal of Physics. (2002) vol. 23. There is an online paper for this, but I had to look at it through my library. If you search for the title, you should be able to find something.
- J. Hackbarth “Multivariate Analyses of Beer Foam Stand” Journal of the Institute of Brewing, 2006. Here is a pdf version from scientificsocieties.org.