
Here's a graph showing the extent of arctic sea ice as measured directly and indirectly for the last several hundred years:
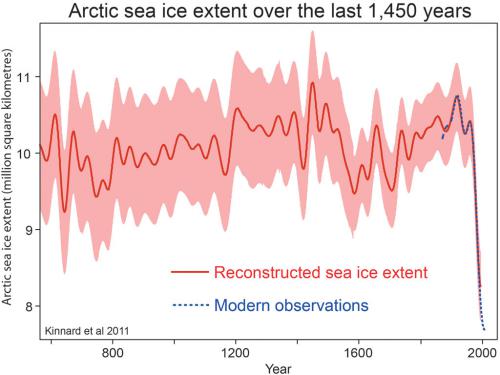 Solid red line is the reconstructed 40 year smoothed, late-summer Arctic sea ice extent from Kinnard et al. (2011). Shaded area shows 95% confidence interval. Blue dashed line shows modern observations.
This graphic is from Skeptical Science, where you can also download a higher res version and learn more about the background for these data. Also, on that page is a link to a large number of useful graphics related to climate change.
.
Here are a few links with that graphic:
http://www.skepticalscience.com/Arctic-sea-ice-hockey-stick-melt-unprec…
http://skepticalscience.com/past-Arctic-sea-ice-extent.htm
http://skepticalscience.com/graphics.php
Global warming is a lie because I hate Al Gore!
Global warming is a lie because scientists are stupid!
Global warming is a lie because my car needs gas!
Global warming is a lie because Lush Rimballs says so!
Global warming is a lie because it goes against my politics!
Global warming is a lie because even if it is true, who doesn't like warm weather!
Global warming is a lie because it was cold in Winnipeg last winter!
Global warming is a lie because only Lord Jeebus can change the weather!
Answer that, you smarty pants libs!