
UPDATED: The graphic above is updated from the original post to show the delegate counts this year through the New York Primary. I've also added the projected delegate counts based on my model, as dashed lines, through the end of the primary.
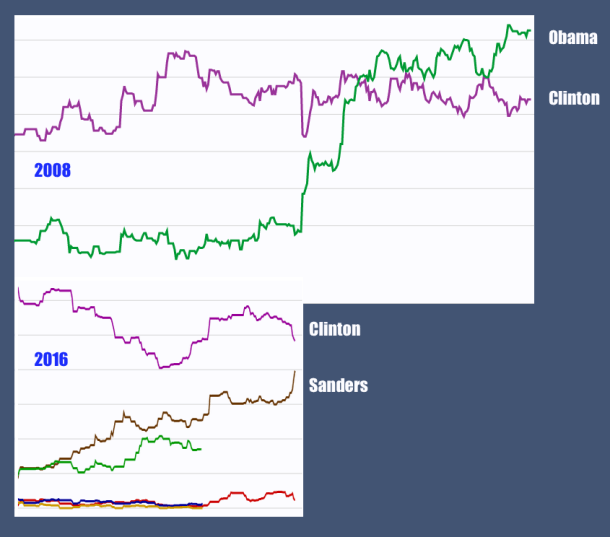
A while back I posted an item comparing the current, 2016, Democratic primary process with the 2008 primary that mainly involved Hillary Clinton and Barack Obama. I posted the following graphic comparing the Real Clear Politics polling data summary over the course of the primary cycle. That was at a point in time when Bernie Sanders was gaining on Hillary Clinton and it started to look like he could catch up and surpass her, much as now President Obama did in 2008.
Now that the primary process has gone along a bit father, it is possible to make a more meaningful comparison between the races. In so doing, note that the schedule for the primaries was very different in 2008. The primary season stated at a different time and the order in which the states voted or caucuses was different.
Now, I'd like to compare the relationship between Obama and Clinton in 2008 vs. the relationship between Sanders and Clinton in 2016, but the timing of everything does not allow a calendar calibrated comparison. So, instead, I'm using cumulative delegates awarded over time as a way of lining up the data.
The graph at the top of the post shows the entire primary cycle in 2016, in lighter and thinner lines, showing how far apart the two candidates were the entire time, and where Barack Obama's line (number of delegates) passed Hillary Clinton's line, as well as a point later on where the lines almost recrossed again.
The thicker lines show only the first half of the primary season, because that is all that has happened so far, indicating the difference in delegate count between Bernie Sanders (red thick line) and Hillary Clinton (blue thick line).
The earlier graph comparing 2008 and 2016 would have given hope to the Sanders campaign that 2016 might be a repeat of 2016. The current perspective, using actual delegate counts, and much farther along in the process, does not. In 2008, Obama passed Clinton when only about 25% of the delegates had been assigned, though Clinton stayed close behind and almost caught up later. In 2016, once the first few contests were over, Clinton has stayed ahead of Sanders the entire time, with the gap widening.
As I've noted elsewhere, the gap will narrow over the remainder of the primary season, but unless voters start doing something really different, Sanders' delegate count will not likely exceed Clinton's delegate count.
Greg,
"Delegates per candidate per primary"?
What does that mean?
I think he is referring to an important aspect of Democratic primaries/caucuses: delegates are awarded on a proportional basis. In other words, there are no winner-take-all states.
Each primary or caucus adds a quantity of delegates to each candidate, and this shows two different primaries. Delegates per candidate per primary.
Greg,
You mean: "This is a plot of individual candidate totals against total delegates awarded for 2008 and 2016."
Right?
I'm sitting there trying to write
D/(C*P)
or anything that might follow from that axis label.
Sorry, I'm just an old physics guy who thinks meters per second means m/s, and stuff like that.
m/s/s is also a physics concept.
Evaluate as per basic algebra.
It is delegates accumulated over time for each candidate in each primary, expressed as accumulated delegates per candidate over accumulated delegates across all candidates per race, for two time periods.
Putting it another way, this graph shows how Clinton and Obama did in relation to each other over the course of the primary season in 2008, and how Clinton and Sanders are doing in relationship to each other over the course of the primary thus far, scaled to be comparable by using the cumulative delegate total in each primary to line up the two years on the same chart in a sensible way.
Greg,
Using the total delegates as a stand-in for time is an excellent, clever approach to plot both primary years together.
It's the label of the vertical axis, and saying "accumulated delegates per candidate" over accumulated delegates that is confusing. For most people, "per" and "over" indicate division. "Against" is the correct term for plotting variables.
"Delegates accumulated by each candidate against the total delegates accumulated to that point."
Zebra, you're confusing the graph title with the Y-axis title...
Another comparison worth noting, from a NYT article:
Funny how she wasn't such a dishonest greedy slut beholden to Wall Street yadda yadda when she was running against an African-American.
We plot Y over X.
Zebra, yeah, white men in 2008 didn't vote for the black dude, and white men in 2016 are not voting for the chick.
Greg,
And it's the same white men. At least there's a hierarchy of values established.
WRT graphs for public consumption: I get it, but having taught high school math to college students a fair amount, I think one has to be careful about more advanced jargon creeping into the communication.
Do you have the same graph without Super Delegate counts?
Dizzle, No consdieration of so called "super delegates" here at all. Thery are not included in any analysis I do.
Thank you, Greg. I'd love to see an update of these graphs!
Greg,
can you re preform your analysis at this point, without the super delegates please :). That would be amazing.
Steven, I don't use any super delegates in this analysis at all. I'm only referring here to pledged delegates.
Wish this graph was updated to reflect the most recent results! But thanks!
Lannar, I'll make a new set of numbers some time this week, or weekend.
I would also love to see this updated, because there are so many Bernie supporters who keep trying to use the Clinton vs Obama nomination as proof that Bernie has a chance, when the differences are significant.
As requested, the delegate count graphic is updated to include through New York, plus I've added projections based on my model through the end of the primary season.
Are you including super delegates or just pledged delegates??
Jill, I'm not looking at super delegates at all, only pledged delegates
I decided to run some math on this. I used the beginning of May for 2008, but I'm curious to see at what date in that primary the percentage of pledged delegates awarded was equivalent to today in the 2016 race, as California had already voted in 2008 by this point.
2016 - Pledged delegates as of now
NeededRemainingPercent
2,38392138.6%
ClintonSandersDifference
1,7681,497271
2008 - Pledged delegates as of 5/1/2008
NeededRemainingPercent
2,11840819.2%
ObamaClintonDifference
1,5561,420136
Difference to remaining ratio (needs X% more delegates than front-runner to break even)
20082016
33%29%
Clinton was further behind Obama on 5/1/2008 in regards to percentage of delegates behind, than Sanders is today.
Better to scale it to percent of total delegates awarded so far rather than the o time.
Greg, thanks for your response. I'm not a regular reader, but I enjoyed this analysis of these datasets, and I think it provides a really solid point of discussion. It's sorely needed when every news network spends all their time talking about "momentum".
I feel that the timeline probably has more to do with people arguing over Sanders conceding, than the delegate gap vs remaining ratios. They're getting upset because they want their nominee to pivot to the general.
The emotions are even hotter because the Republicans were able to finish early, and have a head start on consolidating their base and focusing their attack.
The way the 2008 and 2016 primary calendars were different makes them somewhat incomparable when taking into account the pressure of the time left before the convention. California voted on February 5th in 2008, but is still up for grabs today. At this point in 2008, the primary with the most delegates remaining was Puerto Rico.
To conclude, I understand why people would want Sanders to concede the nomination, and if the same situation was present in 2008, Clinton would be getting just as much heat. I don't think it's just about the delegate math though, it's more to do with the scenario. I think Sanders should stay in, and that every state should vote for the candidate they prefer, because I feel that this year's primary has turned in to a referendum on what the future of the Democratic party should look like. Someone like Sanders ending up with 45% of the primary votes sends a very clear message to the DNC, and hopefully, the party will unite again when the convention is over.
RJ, well put.
@29. RJ :
I see your case there but I don't entirely agree with it. I place more emphasis and weight on stopping Trump and the Republicans from taking over the White House as top priority and thus I think anything that hurts that and that de facto helps Trump is something that should be avoided.
I think Sanders staying in even though it has long been clear that he will NOT be the Democratic party nominee is hurting the party and ultimately making a Trump victory more likely. The sooner the Democrats can stop the ongoing attacks on Hillary Clinton from their own side and start strongly supporting her for the Presidential election the better.
I like Bernie Sanders and his policies but pragmatically and with the perspective of doing the most good and least harm I think Sanders should bow out gracefully now -in fact should have already done so. he should also call upon his supporters to stop bashing Hillary Clinton and to make sure they support her and don't stay home and thereby lead to a Trump victory.
I also think that Hillary Clinton could do more here to help this including possibly making him her running mate which I think would be a good ticket. That option seems to get less likely the longer Bernie Sanders stays in and keeps letting his worst supporters say the worst things and make the vilest attacks about the person who is now the only alternative to a Donald Trump presidency.
This election will have dramatic impacts on the globe and all who live on it. Please choose wisely.
Hi there,
Nice comparison. Could you do an update to extend the comparison to the current date?