
UPDATE (Aug 30th)
Irma is a new named storm in the Eastern Atlantic. See this post for details, eventually.
UPDATE (Aug 29th)
There is a system currently raining on Cabo Verde, off the West Coast of Africa (nee Cape Verde) that is expected to develop. It is on the verge of becoming a tropical depression. The National Hurricane Center has estimated that there is a high probability of this stormy feature becoming a tropical storm in a couple of days or so. If it gets a name, it will be Irma, unless some other large rotating wet object takes that name first.
UPDATE (Aug 29th)
How is the Atlantic Season doing so far, in relation to most hurricane seasons?
Using data from NOAA, we can say that on average (using the 1966-2009 baseline) we reach the eight named storm in the Atlantic (Harvey is the eighth) on September 24th. So, we're having more named storms than average.
This year so far we've had 3 hurricanes. Normally one reaches that number of hurricanes on September 9th. That's a week and a half from now, so we can declare this year a bit above average in this measure, but not spectacularly so.
So far this year we've had one major hurricane (Category 3 or above). There are some years with zero major hurricanes, but on average one major hurricane occurs by September 4th. So, we're close to average now.
UPDATE (Aug 29th)
The following posts discuss various aspects of Harvey
Harvey The Hurricane: Truly Climate Change Enhanced
Is Harvey a failure of the assumption that we’ll adapt to climate change?
Harvey’s effects on petroleum pricing and related things
UPDATE:
I'm writing up Harvey here on its own post. This is going to prove to be an important hurricane. If you are in Texas get caught up right now.
UPDATE:
Well, finally, something interesting happened in the Atlantic! Tropical Depression Harvey is heading for Texas and in a very short amount of time is going to whip up into a hurricane and hit the Lone Star State right on the coastline.
From the NWS HPC:
1. Harvey is likely to bring multiple hazards, including heavy
rainfall, storm surge, and possible hurricane conditions to portions
of the Texas coast beginning on Friday.2. Heavy rainfall is likely to spread across portions of eastern
Texas, Louisiana, and the lower Mississippi Valley from Friday
through early next week and could cause life-threatening flooding.
Please refer to products from your local National Weather Service
office and the NOAA Weather Prediction Center for more information
on the flooding hazard.3. A Storm Surge Watch is in effect from Port Mansfield to High
Island, Texas, indicating the possibility of life-threatening
inundation from rising water moving inland from the coast during the
next 48 hours. For a depiction of areas at risk, see the Storm
Surge Watch/Warning Graphic at hurricanes.gov.4. The Potential Storm Surge Flooding Map is available on the NHC
website. This product depicts a reasonable worst-case scenario -
the amount of inundation that has a 10 percent chance of being
exceeded at each individual location. Because the Flooding Map is
based on inputs that extend out only to about 72 hours, it best
represents the flooding potential in those locations within the
watch area.
______________________
We still hear the yammering that climate change has not affected storms. "They said there would be more storms. There's no more storms," they say.
They are wrong in so many ways. For example, the total energy observed in tropical storms around the globe is up. There have been several big huge scary storms in the tropics in recent years, some of which are unprecedented in their size, strength, rapidity of forming, when they formed, where they went, and what they messed up. Other types of storms show either likely increases or, if not clearly increased yet, still show strong liklihood of increasing in the future based on models. Models that are good.
This is from Emannuel 2005, showing his "Power Dissipation Index" over time and sea surface temperatures.
 Smoothed Power Dissipation Index (dotted line, a measure of hurricane intensity) versus Tropical Atlantic Sea Surface Temperature (solid black line)
This shows the long term up and down swings in total tropical storm activity, and an overall upward trend exactly as expected with effects from global warming.
This is from "Increasing destructiveness of tropical cyclones over the past 30 years" by Kerry Emanuel, Nature 436:686-688.
See also this post for more details.
Roger Pielke Jr. is one of those yammering fools (I used to try to be nice to him until he accused me of horrible things a few months back and almost none of them were true!) who will tell you this. Roger says, there have bee no more landfalling Atlantic Hurricanes in the US recently than ever before. But trying to figure out what is occurring on the Earth by only considering what the smallest of the Hurricane basins produces, and only counting the small subset of those hurricanes that hit the US (and, by thew way, ignoring some of them such as Hurricane Sandy in order to fudge the numbers) is like trying to get a handle on the frequency of major train derailments by watching the 100 mile length of track you drive along five times a year on the way up north fishing. Nobody would do that. Except Roger.
The normal number of named Atlantic storms is 12.1 of which 6.4 are hurricanes, and 2.7 major hurricanes, in a given year. The record high is 28 named storms, and the record low, is 4.
There have been various predictions for how much storm activity we expect this year. The predictions that are most recent and most reliable call for 11, 12, 11-15, 14, 11-17, and 15.3 storms. So, generally, close to average plus.
The prediction I watch most closely is from PSU's Earth System Science Center. PSU has been making very accurate predictions for a number of years. For this year, they predict 15.3 +/- 3.9 named storms this year (i.e., about 11 to 20 with the best guess being 15). Their prediction will drop a little if there is a mild El Niño this year, but that seems increasingly unlikely. Also, PSU has a second alternative model that produces a lower estimate, of around 12.4.
So, in short, barring an El Niño, we can expect a near average but slightly above average year for Atlantic hurricanes. And no, that does not mean that global warming is not happening. It means that no derailments are expected along a particular section of recently maintained rail track.
Anyway, for the second year in a row, IIRC, we got cheated on our A storm. Below, I've put the official list of storm names for the Atlantic 2017 season (as headings, we'll fill in info as the year progresses), but the first tropical storm to talk about today, 19 days into the season, is Bret (one 't'). Arlene happened last April.
Tropical storms don't happen in the Atlantic in April. 'Cept for Arlene. Generally, it seems like the boundaries are becoming enfuzzied. Expect more "extraseasonal" storms over the next few years, and expect eventually, perhaps a decade from now, for the National Hurricane Center crew to be asked to start watching year round, because a tropical storm that hits your fleet in April is still a tropical storm. Even if Roger says it doesn't exit.
Bret
Bret formed near the very southern edge of the Atlantic Hurricane basin. 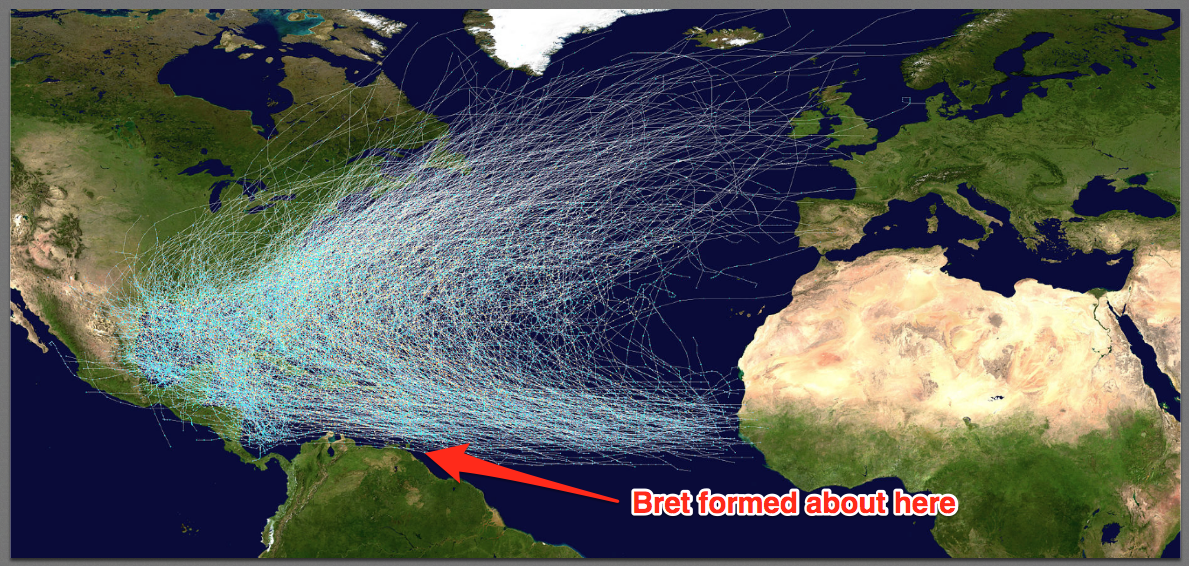
This is the earliest far south forming hurricane in the Atlantic Basin. So, our first storm of the season happened months early, the second storm hundreds of miles south, compared to normal. Roger that.
Bret will menace the northern edge of South America, then in a few days from now it will be gone. Bret is not expected to strengthen and will not be a hurricane. Nor will it hit the United States of America. Therefore, according to Roger, Bret, as novel as it is, does not exist.
Cindy
The next storm, to be named Cindy, is very likely to form from a disturbance now seen in the south-central Gulf of Mexico. This is fairly typical place to see a tropical storm or hurricane form this time of year. Cindy will likely become a north-moving tropical storm, and will likely stay just at tropical storm strength, coming ashore somewhere between Houston, Texas and Morgan City, Louisiana. The chances of Cindy wetting down NOLA is very good, but again, this will not be a hurricane. This will happen some time late Wednesday, most likely.
While possible-Cindy would transform from a tropical storm to a depression with landfall, the storm will track up the Mississippi and cause lots of rain.
What a bummer.
"EXCLUSIVE: 60% Of Millennials Willing To Give Just $10 Or Less To Fight Climate Change"
http://www.dailywire.com/news/17674/exclusive-60-millennials-unwilling-…
Dear Greg,
The picture you draw remarkably conforms predictions Kees de Haar, medium in Alphen, received in 1984-2005. If the trend, which he got predicted, proves alright all the way, there will arrive a lot more hot stuff, one can get real upset about. Upsetting yourself has no use. Things come as they come, regardless the shock and awe and opinions they provoke. In human sense it doesn't do us any good to mock and scream. Let's concentrate on what is happening. I am author of the three volume study ‘apocalyps of the earth in five stages’ (2017) with additional information from above, which by the way proves the study ´The path of the pole´, of Charles Hapgood and others, with a foreword of Albert Einstein. For the better understanding of processes I give you my conclusion: climate change is earth change, we all are in the middle of it, whether we like it or not. Keep Calm and Carry On.
Kind regards, Gerrit Bogaers, Laren NH, Tuesday 20 June 2017, 7.56 AM Dutch time.
I thought ACE was at a record low for North America, and less than 50% of "normal" for the world?
http://models.weatherbell.com/tropical.php
So what made you think that?
Yeah, call on some quack bullshit about a "medium" who, as they all do, writes stuff that so vague it can be shoehorned into supporting anything and toss it out here -- that will make people realize there is a problem.
Oh wait, no, it will
a) make sane people laugh and say "What kind of idiot believes in fortune telling?"
b) make the people who are already denialists (like rickA) say "See, this is all they have."
Gerrit, that crap doesn't help anything.
Gerrit, that is, an entirely new form of denial! A mystic predicted some of the effects of climate change, therefore they are not real. Holy f'in crap!
RickA:
ACE is one way to measure tropical storm activity, but if you want to measure total storm energy across basins over time it isn't good for that. It measures what is going on in only part of the storm. Some of the biggest and most destructive storms ever seen have had relatively small contributions to ACE.
Both ACE and other measures, including simple observations like the number of storms, go up and down in long term cycles. These cycles are too long term to pick up what we expect is a signal of serious change in climate patterns starting around 1980. We do know that after 1980, the Atlantic basin experienced a huge increase in storms several years, and this was one of those periodic uptics. Was that uptick greater than previous ones because of climate change? Will the next uptic be greater than earlier ones because of climate change?
The answer from the empirical data is: Impossible to say. Evidence is abscent. (There is no evidence of a lack of change, but simply, not enough evidence to say if there is a change or not, because post 1970 data are not comparable with pre 1970 data).
The evidence from modeling is yes, there will be an increase.
Having said all that, the data globally as analyzed by Emannuel and others shows an increase in storm activity globally. The Atlantic basin is about 13% of the total global storm energy.
I'm adding a graphic above to show Emannuel's work.
A further confounding factor in detecting increases in hurricane activity is small number statistics. If you see 28 tropical storms in a basin one year, and 18 the next, that is only a 2σ decrease, barely enough to be considered significant, even before you consider climatological factors like the ENSO phase. So you need a much longer time base of measurements than we currently have to determine whether storm numbers are increasing or not. Before about 1970, when satellite observations became available, we missed a lot of tropical cyclones--that's less true of the North Atlantic than the rest of the world, but some short-lived storms probably would have been missed even with the amount of shipping in the North Atlantic.
One trend that should be worrying people who live near the Atlantic/Gulf coast (and coastal southern California, where tropical cyclone activity is rare but not unprecedented) is that we are seeing tropical cyclones in unusual places. Such as Brett just off the coast of Venezuela: tropical storms near the South American coast tend to ingest a lot of continental (dry) air, which inhibits development and will likely kill off Brett over the next two to three days. Or Alex in the Azores. Or the storms we saw last year approaching the Hawaiian Islands. The window of vulnerability is increasing geographically as well as temporally.
Eric: One of these days a Patricia like storm is going to whack LA or San Diego. That has in fact happened in the past but beyond memory. The storm hikes up unexpectedly to Cat III strength within a single news cycle so most people miss it, whacks into Coronado and next thing you know, fish tacos everywhere. But not in a good way.
I can think of ways to track storms in the Atlantic over long periods. There are weather stations that are very old in places like Bermuda and Jamaica (all the British colonies) I assume. A simple tracking of barometric pressure at 30 locations in the basin for the last 30 years should correlate roughly at a decadal scale to TC activity, and then that can be extrapolated back until the number of stations starts to drop below some number. I suspect we can see TC activity back to close to 1700 using this method.
This would produce only about 10% of the ideal data set for looking at annual patterns, but a running mean of 30 year periods should show the overall pattern. If it follows some other data such as sea surface temperature, that would more or less confirm it.
But that is a lot of work for a fairly uncertain outcome. The modeling is better, cheaper, works now, and tells us to get more plywood.
Is there an updated Emmanuel chart? Looking at ACE in the same timeframe is similar, but the longer term picture is flatter.
https://en.wikipedia.org/wiki/Accumulated_cyclone_energy
For North Atlantic tropical storms, we have pretty good (but not perfect) records going back to 1851. The British, and later the Americans, encouraged ship captains to keep weather records. A few small and short-lived storms would have been missed--only during the satellite era can we be confident of catching those--but any system that lasted at least 24 hours or so would have been detected. To go back further we would have to develop some proxies, which would be a fair amount of work. The method that you suggest might work. But as you say, that would only get us about 1.5 centuries. The barometer was only invented in the late 17th century, so there would be no way to push it further back.
But the North Atlantic is only a small fraction of the world's oceans, and shipping networks in the pre-satellite era were not so dense over most of those oceans. Which is why it is still a fair statement that we don't have good worldwide records before about 1970.
Well I'm still waiting for dick to say why he thought ACE was low. It's a nonsequitur here. I thought temperature anomaly was higher last year. Has bugger all to do with the trend, so if I were to bleat it out randomly it would be quite reasonable to conclude I was a duplicitous fuckwit, no matter how accurate the claim.
So I'm waiting to see why dick thought his thought.
#12,he answered even before you asked it. Unlike you, his links actually demonstrate what he claims.
No, he didn't "mike".
Please remove your head from your anus.
"mike", read again.
It’s a nonsequitur here
I thought temperature anomaly was higher last year. Has bugger all to do with the trend
So, no, I'm not asking what makes him believe that ACE is lower, but what makes him think that it's relevant to bring it up in a discussion NOT about ACE?
Wow #4 asks "So what made you think that?"
Well Wow - if you follow the link I put in #3 and read the words at that link, you will see why I think what I think.
No, what made you think it? Not what evidence you have for it, why did you think it.
You dumbfuck idiot.
Wow @12 - "Well I’m still waiting for dick to say why he thought ACE was low"
Wow @15 - "So, no, I’m not asking what makes him believe that ACE is lower"
Classic Fuckwit.
'Sandy' was a typical cold-core low and not a 'hurricane'
addendum:
Sandy did start out as a cat 1 hurricane but went through complete extratropical transistion. Was it sort of a 'hybrid' for a time? Sure, but that is not unusual.
https://www2.ucar.edu/atmosnews/perspective/8243/hybridization-sandy
Well not unusual, just much later much further north much bigger and did more damage than anyone had seen before. Because it had sub-hurricane wind speeds. And it's impossible for a merkin to wrap their heads around a multi-dimensional rating. One dimension only, please!
Betula,
“Well I’m still waiting for dick to say why he thought ACE was low”
He's now claiming he meant to say why he thought this was relevant, which is in the rest of his post in a verbose way. Greg Laden thought it was relevant enough to give a detailed answer, but for some it was a thought crime.
No, I asked what made him think it. Your stupid posts make me think you're an idiot.
Cause.
Effect.
So what made him think to tell us about ACE in a discussion about total storm activity? Because I would prefer to let the fuckwit hang himself rather than assert what I think is patently obvious.
"He’s now claiming he meant to say why he thought this was relevant"
I wanted, and said right there, to know what made him think that post's assertion of what he said he thought. I don;t care why he might think it relevant, since he may actually admit it was 100% irrelevant and thought so at the time.
Fuck, he may even have some "reason" why it actually is the same thing, therefore validly a claim, as he clearly wishes to imply without the danger of actually saying anything, that greg is incorrect and so is Emmanuel 2005.
Did he "think" it relevant (in which case, how)? Did he think it irrelevant (in which case, why bring it up)? Did he think it was a gotcha (in which case he's definitely stupid and shit stirring)? Or did he get told to say it (in which case, who)?
Sure the original post asking why he thought that could be miscontrued, but the posts made later indicate precisely what I meant and is conformal to the question posed earlier. Yet dick didn't notice and you belatedly notice but refuse to accept that there was an error in comprehension on your part due to multiple meanings being possible.
Which, I assume (and I will assume since you seem so hostile to actually asking before I leap to a conclusion about motives) is because you want to pretend that somehow I asked the "wrong question" and are hiding it to poison the well as if somehow his mistake can be ignored as long as anyone questioning him can be made out to be incorrect somehow too.
You know, straight party politics covering your ideological brother because you can't afford to let truth dent your rightness.
Wow. Wow, I think I've got a 'true believer' here. The evidence is weak for increased anomolous events outside natural variation.
Carbon has been pretty good for people -- I must admit this even though I propose that carbon from the biomass derived from hemp would be loads better than than that derived from current wars over oil.
Wow:
ACE seemed relevant to me because it is a measure of Hurricane energy (accumulated cyclone energy). ACE is low (in the Northern Hemisphere). Greg says that is actually misleading, referring to another measure of energy. But Greg's data only really seems to go up to 2000 and 2004 - so what about the last 13 years?
So I asked about ACE because it seems to contradict Greg.
That is why I mentioned ACE.
"Wow, I think I’ve got a ‘true believer’ here. "
Of what?
"The evidence is weak for increased anomolous events outside natural variation. "
OK, but why tell me? The IPCC reports say exactly that. Do you "believe" that I believe differently from the IPCC?
"Carbon has been pretty good for people "
Nonsequitur and irrelevant.
I think we have a reality denier here.
"carbon from the biomass derived from hemp would be loads better "
I suppose that would indicate why you came out with the odd statement "I think I’ve got a ‘true believer’ here.": you've smashed your brains out on gange.
" ACE is low"
So what?
"ACE seemed relevant to me because it is a measure of Hurricane energy"
But that's irrelevant. Do you not know what ACE stands for?
"So I asked about ACE because it seems to contradict Greg."
OH! So you DON'T know what ACE means!
OK, yeah, you're a moron, then. total storm intensity is not the same thing. That's why they use different words.
Yes, what would ACE, which is a tool used to categorize North Atlantic hurricane seasons as being above normal, near normal, or below normal, have to do with a post about Atlantic hurricane seasons?
And why would Greg use a chart from 2005, leaving out activity (or lack of) over the past 12 years?
Figure 1 of this 2008 paper shows the two indices to be about the same, and the positive trend comes from using the 1970s start date.
http://journals.ametsoc.org/doi/full/10.1175/JCLI-D-11-00146.1
However, that does not prove they are the same thing, therefore despite being "about the same" in the selected period, they aren't.
So confusing the two is complete idiocy.
Moreover,now having scanned the paper, it's also not talking about the same thing either. PDI this time.
YOUR idiocy.
" the positive trend comes from using the 1970s start date."
For this claim to be true, you have to show that the trend varies because of the start date. But there is nothing there that indicates this to be the case and that seems to be your own singular ass-pull of a claim based on, well, fuck all as far as I can tell.
So three claims made, 0 out of 3 valid from data presented. And all in one sentence!
> three claims made, 0 out of 3 valid from data presented. And all in one sentence
You took a lot longer to get everything wrong, and still missed the one error that was made- data is thru 2008, but the paper is later.
Nope, incorrect.
Nor have you managed to earth up what you found.
I take it you didn't take time to read Landsea, right? You just read "adjustment in 1970 according to Landsea" and leapt, like any shitheaded denier to a claim of data fiddling to make a trend.
Because 2008 is not 1970 and you claimed the trend change was due to 1970. No evidence of the trend change, no evidence it would be due to 1970.
Oh, and so what if the paper was later? YOU were the one bringing it up in a conversation where "dick" claimed ACE was relevant and showed greg "wrong". If you bring up an irrelevant (by ending too early) paper to that claim, you can't blame me for not bothering with what it didn't cover. It's ending is just another proclamation you have made and only AFTER the earlier post I responded to.
So you managed a double fail in the latest BS post. Ironny? Is that you?
Bottom Line:
"it is likely that the increase in Atlantic tropical storm and hurricane frequency in HURDAT since the late-1800s is primarily due to improved monitoring"
"We are unaware of a climate change signal that would result in an increase of only the shortest duration storms, while such an increase is qualitatively consistent with what one would expect from improvements with observational practices"
"We find that, after adjusting for such an estimated number of missing storms, there is a small nominally positive upward trend in tropical storm occurrence from 1878-2006. But statistical tests reveal that this trend is so small, relative to the variability in the series, that it is not significantly distinguishable from zero (Figure 2)."
"Thus the historical tropical storm count record does not provide compelling evidence for a greenhouse warming induced long-term increase"
https://www.gfdl.noaa.gov/historical-atlantic-hurricane-and-tropical-st…
>You just read “adjustment in 1970 according to Landsea” and leapt, like any shitheaded denier to a claim of data fiddling to make a trend.
Nope. 1970 is from Greg's chart, has nothing to do with Landsea.
"1970 is from Greg’s chart"
No, it is from the paper and post you supplied:
http://journals.ametsoc.org/doi/full/10.1175/JCLI-D-11-00146.1
See the graph? The dates? 1970 is in there. See the text in the paper you supplied a link to? 1970 is in there. See the post that you made that link? 1970 is in there from you.
Stop lying so BADLY, "mike".
Oh, another indicator that this latest post from you is a really terrible attempt to lie, "mike" is that the claim you made in defence of my reply was "data is thru 2008, but the paper is later", but Greg's graph only goes to 2004 and the paper it comes from is 2005, neither after or even on 2008
Reading comprehension doesn't work for you I guess.
Claims contradicted by evidence again, "mike"?