
I've described before how there is a significant correlation between poverty and educational performance when we use state-level data. But as I pointed out, one of the interesting things is that the residual--the difference between the expected scores for a given state and the actual scores--can be quite large for some states (e.g., Massachusetts does much better than expected, Arkansas much worse). We can learn a lot from these differences (i.e., what does MA do differently from Arkansas). But if we look at only one state, can we determine what the effect of poverty is?
To do this, I've pulled the MCAS test data, which has both the test scores and student demographic information broken down by school (and district). I've decided to focus on 10th grade scores, and MA reports scores for math, English, and science. Before we get to the findings, I'll give a brief outline of some of the caveats, data decisions, and so on. To start with, I'm using the 2009 reported data. While no standardized test is perfect, the MCAS is better than many: we haven't seen the doubling and trebling of these scores, as has been observed in other states*. Because these tests have been instituted for a long time, we have a good idea of what they test. Also, since these scores are from the same year, we have controlled for the 'lousy' test effect--even if the test isn't perfect, all students receive the same test (obviously, if the test is ludicrous, such as nearly everyone fails, then there are issues).
A bit more about methodology, then...dataz!
In Massachusetts, students are placed into one of four categories, based on their scores: Above Proficient/Advanced, Proficient, Needs Improvement, and Warning/Failing. In what I'll be showing you, I've lumped Above Proficient/Advanced and Proficient together, and also Needs Improvement and Warning/Failing (to me anyway, that seemed to be the obvious split). I've regressed this against either the percentage of kids in a school who qualify for free lunch (a common surrogate for poverty) or the percentage of kids who are considered to be low income**; the regressions are slightly worse for low income, as it's a broader definition, so I'm only showing the free lunch data for clarity. I've also looked at English as a second language, and it actually is quite weak in comparison to poverty. Finally, I removed any school that tested twenty or fewer students.
For tenth grade math scores, here's what we see:
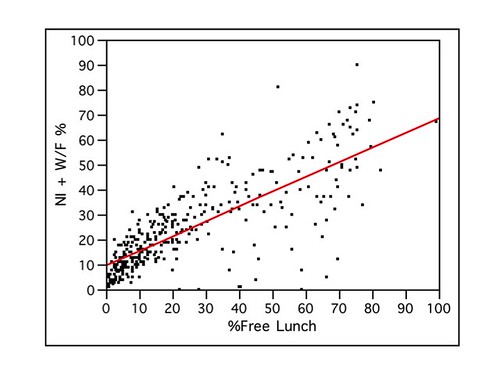
To walk you through this, on the x-axis (the horizontal) is the percentage of students at a school who are eligible for free school lunch, and on the y-axis (the vertical) is the percentage of students at a school who are either Needs Improvement or Warning/Failing in math. This relationship is significant (p 0.0001 or less a one-in-thousand chance of being a statistical fluke). The R2--how much of the school to school variation is accounted for by variation in school lunch eligibility--is 0.61 (which is pretty strong; this isn't a lab experiment under controlled conditions). The slope of the regression is 0.59, which means a one percent increase in school lunch eligibility, the percentage of poorly performing students in math increases ~0.6% (0.59% to be exact).
Here's the tenth grade English scores:
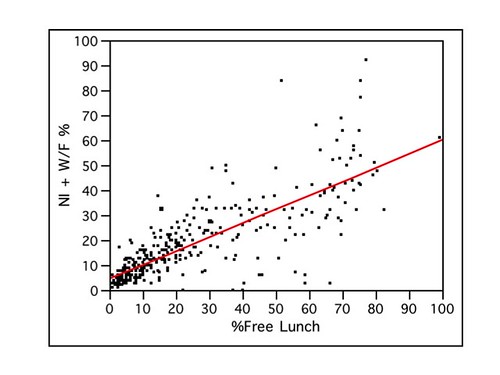
For English scores, the R2 is 0.62, and the slope of the regression is 0.55 (p 0.0001); per above, a one percent increase in school lunch eligibility means the percentage of poorly performing students in math increases 0.55%.
Just one final point before we get to the big picture: you'll notice that, in both of these plots, there is much more variability in test scores as poverty increases. That's both a good and bad thing. Some schools are performing much better than their demographic 'destiny' (Yay! Let's celebrate with a heart-warming cheesy Lifetime channel movie). Other schools, however, are doing worse.
To put this into context, we should look at how many students qualify for free lunches. Statewide, the top quartile (the 75% highest) is 38.1%, while the lowest (25% 'highest') is 7.8%. The expected tenth grade English poor performance rates are 26% and 9.2%, respectivelyâ . For math, they're 34.3% and 14.4%. Now, if you look at the plots, you'll see that at the 75th percentile (38.1% free lunch mark), some schools do very well. Great! I would rather see that our children is learning (to use a phrase) than have a stronger regression coefficient. But, on the whole, the low-income schools are not doing nearly as well as those in the top quarter (less than 7.8% free lunch).
Poverty, even in one of the best educational systems in the world, accounts for a lot of poor performance. Like it or not, we can't begin to understand educational performance without considering poverty--it's a big factor (or we can just blame teachers. That's certainly easier). Mind you, the effects of poverty could include everything from parent educational status to poor schools being neglected in terms of funding, quality teachers, and principals. Unfortunately, this is almost never mentioned--or worse, it is mentioned and then elided past with a sad shrug of the shoulders.
But, as I've noted before, this is also a key issue for revitalizing our cities. While I'm not trying to force everyone to move to cities (OH NOES! MY SEKRIT PLANZ!), cities have a lower per capita energy impact than the suburbs: if we want to get serious about global warming and energy self-sufficiency, we need to revitalize our cities.
Making cities livable--and they are affordable if you don't have to pay for private schooling***--will hinge largely on the perception of their schools. But as long as urban areas serve as warehouses for low-income households (surburban and exurban areas 'zone out' housing for low-income families using regulation****), their test scores will never be as good those for suburban schools.
Anyway, tomorrow, I'll make you really depressed by describing the relationship between low incomes and science education.
*In 2006, the classification of exam scores was adjusted. I'm using the 2006 adjustment.
**Low income is defined as:
The student is eligible for free or reduced price lunch; or
The student receives Transitional Aid to Families benefits; or
The student is eligible for food stamps.
***Automobiles are really expensive, but, currently, if you have to choose between car ownership or private schooling, car ownership is cheaper.
****It's funny how most libertarians, though not all, don't seem to care about zoning regulations, which arguably do as much as any other regulations to limit freedom of mobility and opportunity. Just saying.
â There's a small x-intercept which is why these numbers are higher than you might expect (if you remember back to your algebra class, that's the "b" in "y = mx +b".
Awesome work. FYI the relationship (r-squared) used to be ~77% back in the late 1990s. Ed reform and a few billion dollars has helped, but will probably never end the relationship between income and education outcomes.
It strikes me that the most interesting question is "What is different between schools where poverty is a good predictor of failure and those schools where it is not."
Thank you for the data crunch.
I'll echo commenter #2 as well.
My "mileage varies" on the discourse around the poverty effect. It's far more common hereabouts to blame poverty (as a proxy for blaming kids) for educ. failure rather than teachers (I'd just as soon that folks stopped blaming & started fixing). Also, intemperate zoning & land use regulation processes are well identified by many who prefer market-based solutions (if that's what's intended by 'libertarian') as barriers to affordable housing, standards of living, etc.
You're absolutely right about the effect that *not* successfully addressing this issue will have on the health of a city. though.
Thanks for the post.
Hi Mike,
I was wondering if you would help me develop a comparison of the cities in Ma.with the highest poverty levels; (Holyoke 26%, Lawrence 24.3% Chelsea 23.3%, Springfield 23.1%, New Bedford 20.2%, Boston 19.5%, Fall River 17.1% Lowell 16.8%, Lynn 16.5% Fitchburg 15%) with their level of participation (revenue) in the Ma. State Lottery.
My hypothesis is the higher a city's participation (revenue provided to the Lottery),the higher the poverty level in that community (and vice versa.)
The Lottery is very public about the amount of money they send back to the cities and towns but reluctantly shares the information I am seeking. But, it is in the Lottery data base somewhere.
I need a Mad Man to find it.
Can you help me?
Tom Larkin
781-275-8175
romlarkin@verizon.net