
The most important trend in the use of water is the slowly unfolding story of peak water in the United States and elsewhere. Data on US water use are compiled every five years by the US Geological Survey, covering every state and every sector of the economy. The latest data – for 2010 – have just been released, and they show the continuation and acceleration of a stunning trend: US water withdrawals, for all purposes, are declining, not growing.
Traditional water planning and management assume inevitable, continuing, lockstep growth in demand for water as populations and economies expand. This has led to calls for continued expansion in traditional water infrastructure: dams, aqueducts, groundwater extraction, and long-distance water transfers.
But over the past 40+ years, this assumption has been proven false. (See previous commentaries on this, here and here.) New limits on water availability, the changing nature of our economy, new technologies that permit great improvements in efficiency and productivity of water use, and new management approaches have broken the two curves of water use and traditional population and economic growth apart.
In short, the US has reached the era of peak water.
Below are two graphical representations of this remarkable change from the Pacific Institute using data on the US economy together with the USGS water use estimates. The first shows total gross domestic product of the US from 1900 to 2010 (in inflation-adjusted 2005 dollars) together with total “withdrawals” of water for all purposes – from domestic and industrial use to irrigation and power plant cooling. As shown, the most recent water withdrawals data show that withdrawals in 2010 were lower than at any time in the past 40 years back to 1970.
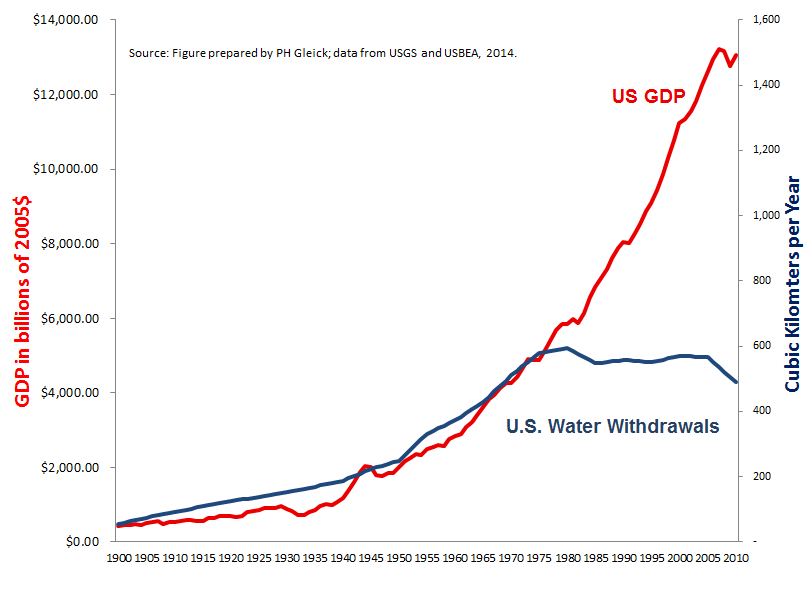 US GDP in $2005; Water Withdrawals in cubic kilometers per year. Data from USGS and USBEA.
The second graph shows the “economic productivity” of water use, measured by the 2005 dollars of gross domestic product generated with every 100 gallons of water withdrawn. This productivity of water use has tripled since 1970 and we now get over $10 of GDP for every 100 gallons of water withdrawn. (Again, these data are adjusted for inflation.)
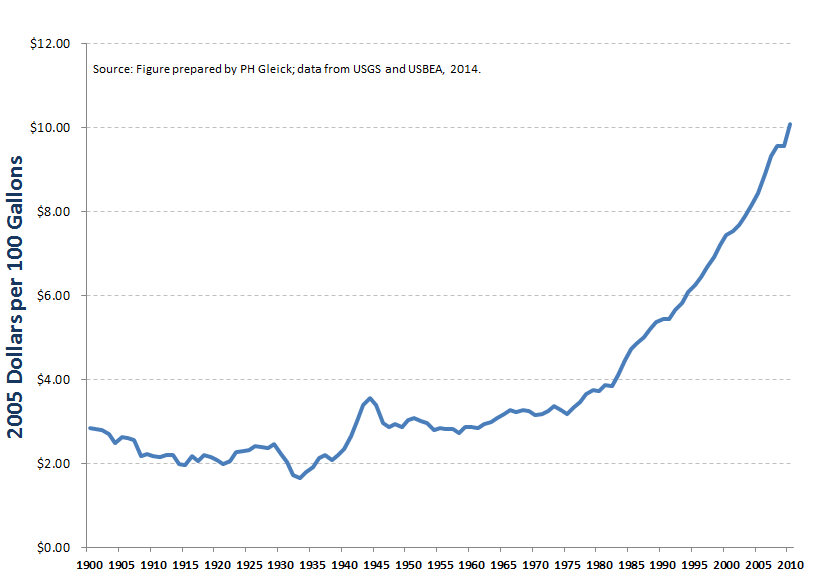 $2005 of GDP produced for every 100 gallons of water withdrawn in the US. Data from USGS and USBEA.
The assumption that demand for water must inevitably grow is false. Let’s start planning for the reality that a healthy economy and population can mean more sustainable, efficient, and equitable water use.
Resources
Gleick, P.H. and M. Palaniappan. 2010. Peak Water: Conceptual and Practical Limits to Freshwater Withdrawal and Use. Proceedings of the National Academy of Sciences (PNAS), Vol. 107, No. 25, pp. 11155–11162 Washington, D.C. June 22, 2010. http://www.pnas.org/content/107/25/11155.full.pdf
USGS 2010 Water Use Data: Maupin, M.A., Kenny, J.F., Hutson, S.S., Lovelace, J.K., Barber, N.L., and Linsey, K.S., 2014, Estimated use of water in the United States in 2010: U.S. Geological Survey Circular 1405, 56 p., http://dx.doi.org/10.3133/cir1405.
Gleick, P.H. 2010. “Has the US Passed the Point of Peak Water?” http://www.huffingtonpost.com/peter-h-gleick/has-the-us-passed-the-poi_b_758698.html
Gleick, P.H. 2011. “Is the US Reaching Peak Water?” Forbes blog post: http://www.forbes.com/sites/petergleick/2011/09/07/is-the-u-s-reaching-peak-water/
[This post also appears in a similar form at Peter Gleick's Huffington Post column.]
What about water use in the parts of the world where most of our old economy is now located? If water use in, say, China has increased in lockstep with our decrease, aren't we just outsourcing our water consumption along with our manufacturing?
Water use in China has indeed grown, with their economy, and this "outsourcing" is a part of the story. But even in China, water use is now leveling off and showing a split from GDP growth.
We still use large amounts of water in ways that contribute nothing to GDP and little to quality of life, such as ensuring that the grass of golf courses and suburban lawns remains green all summer.
I often see comments on the unsustainability of nuclear power, due to its use of freshwater.
Looking at your graph, the US is just below 500 km3 withdrawals per year - which by the 'Total Renewable Freshwater Supply by Country' data annex in 'The World's Water' is under a sixth of the US's annual renewable freshwater supply, 3069 km3.
Given the vast disparity between withdrawals and supply, does this negate that argument? Or is there a good upper limit of freshwater withdrawals that lowers the ceiling on use?
The problem, of course, is that the national "average" hides vast regional differences. Many parts of the US are past the point of "peak water" -- and are reaching limits of renewable supply (or exceeding them). Nuclear power (or any large powerplant that uses water for cooling) requires significant volumes of water depending on the kind of cooling technology used. But I think the biggest constraints to new nuclear plants is not water (except in some regions as noted above), but rather its high economic costs, public opposition, and the availability of cheaper, faster, and cleaner alternatives.
Isn't there a largenblu but? But what about the withdrawals in the San Joaquin valley? Isn't the map of water withdrawals unbalanced?
sorry about that I pressed the submit before editing