"Fortunately for serious minds, a bias recognized is a bias sterilized." -Benjamin Haydon
You might look up at the night sky, at the vast canopy of stars we can see, and ask, exactly, what we're seeing?
Thousands upon thousands of stars, of course, even with just your naked eye. These stars come in all sorts of different sizes, temperatures, and distances, and what we see in the night sky is largely determined by a star's brightness and distance from us.
All the stars you can see with your naked eye belong to one of the seven color classes of stars.
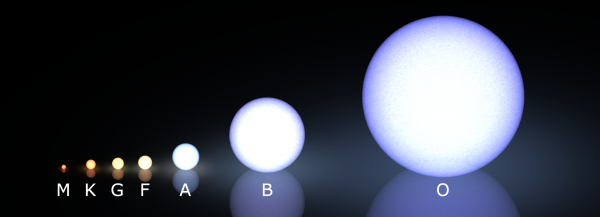
With dark skies, one can easily -- even with just a naked eye -- tell apart the bright stars by their different colors. It turns out that all of the colors -- from the red and orange M- and K-stars to the bright blue O- and B-stars -- are well represented in our night sky.
But when we perform large surveys of the stars, such as in our solar neighborhood, we find something else entirely.
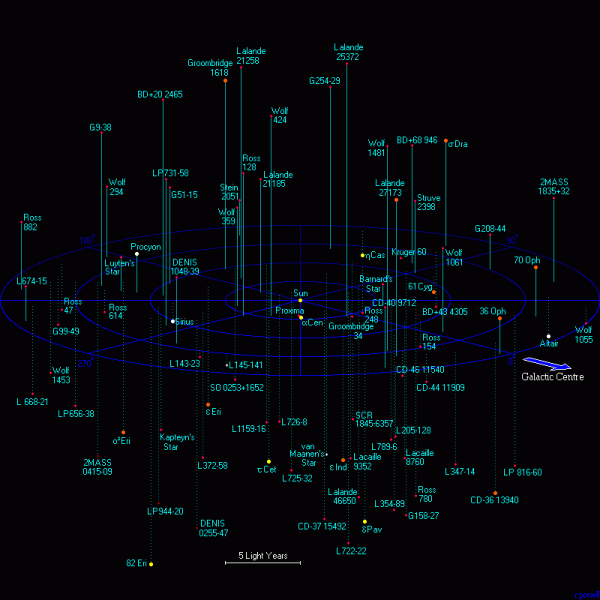
Within twenty light years of our Sun, there are just over 100 stars.
And exactly zero of them are O-stars.
And exactly zero of them are B-stars.
But if we look at the K- and M-stars, they make up over 90% of these stars. In fact, three out of four stars are the reddest, coolest, M-class stars, including the closest star to us.
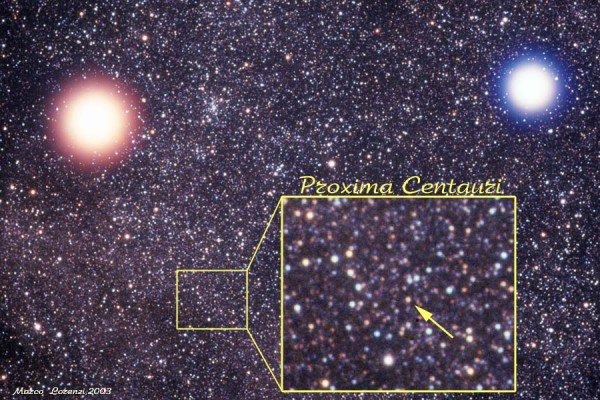
That would be Proxima Centauri, at just 4.2 light years distant from our Sun. The closest M-star to us, Proxima Centauri is invisible even with binoculars, and even with dark skies, a small, 3" telescope would unable to find it.
Because nearly all M-stars are incredibly dim, less than 1% as luminous as the Sun. Compare that to the O-star Alnitak, one of the stars on Orion's belt.
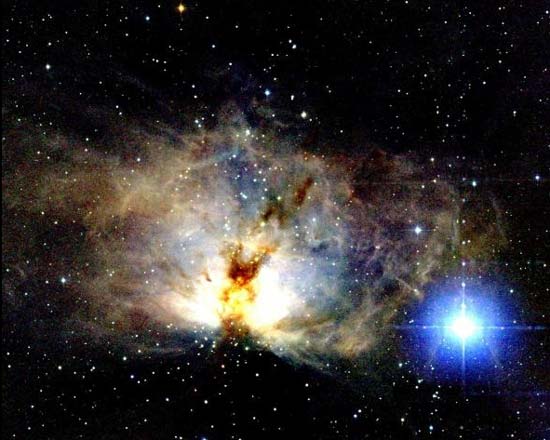
Despite being 700 light years away, Alnitak is one of the brightest stars in the sky (coming in at #31), because it's about 100,000 times as luminous as the Sun!
But O- and B-stars are incredibly rare, with less than 0.2% of all stars making up those types, while about 75% of the stars in existence are M-stars. Yet if we relied solely on our naked eye observations, we see far more O, B, A, F, and G stars than are actually there. Why is that? Because of bias.
In the case of nearby stars, we see more of the stars that are easier to see, because our eyes are biased towards bright stars.
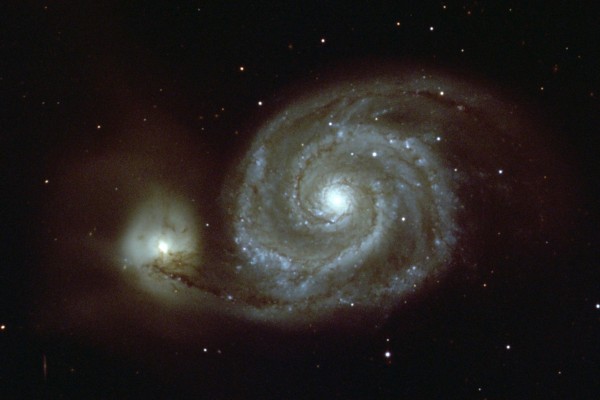
Bias works in other ways, too. Take a look at the Whirlpool galaxy, above. This visible light image traces out very clearly the stars in Messier 51. And you might think that we are seeing the light from the brightest stars -- the O- and B-stars -- that make up this galaxy.
But that's not true.
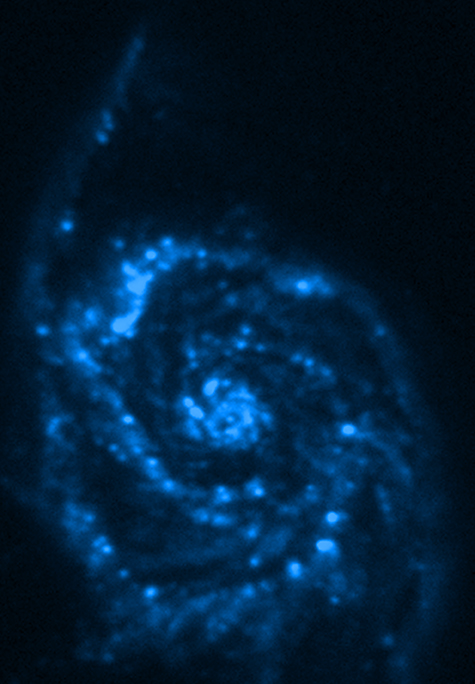
This is where the O- and B-stars live! O- and B-stars, because their lifetimes are so short, trace out the regions of galaxies where stars are newly being formed. By looking in ultraviolet light, we only see the hottest, bluest stars. As you can see, they cluster together in a very different manner than the stars in the visible light images do.
Well, guess what? On the largest scales in the Universe, the way galaxies cluster together is also biased!
The above simulation shows how matter in the Universe -- based on what we know of gravity, dark matter and normal matter -- ought to cluster on large scales.
But that is not necessarily the same as how bright galaxies cluster together!
Moreover, different types of objects -- quasars, blue compact galaxies, or luminous red galaxies -- have different biases from one another.
In other words, when you look at how galaxies actually cluster together, it is related to, but not equivalent to the underlying distribution of total matter.
After all, look at the difference between what the gas (made of normal matter) and dark matter (which isn't) do in a video simulation on the scale of the Milky Way galaxy!
When you're looking for extra-solar planets, don't be surprised that we find the biggest ones and the ones closest to their parent star: that's also bias.
And when you look out at the large scale structure of the Universe, don't be surprised that the brightest, most luminous galaxies cluster together disproportionately largely compared to the underlying dark matter density! The entire Universe may be biased, but as we learn exactly how, we can use this biased data to figure out exactly what it's doing!



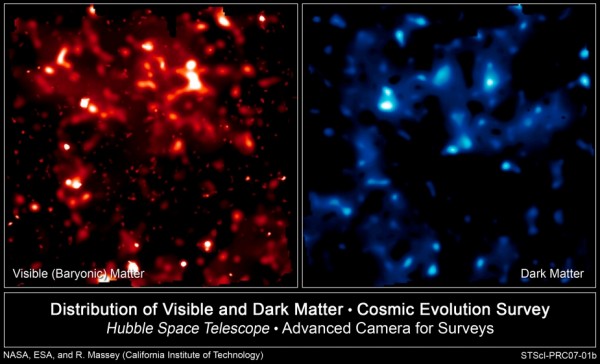
Huh. I had a vague impression (maybe due to the phrase "dark matter halo"?) that the dark matter was more spread out, less clumpy than the baryonic matter. But it certainly doesn't look that way in the simulation. Was I just flat-out wrong, or is hot dark matter the way I thought, and the simulation only shows cold dark matter?
I tell you GOD is good with a "Canvas" outstanding in mathematics & extremely wise in explaining His creation ...
Only the fool ... says there is No God ...
Did I make this up or am I just getting old: We remembered the spectral classes of stars with the mnemonic " Oh, B A Fine Girl, Kiss Me (now)!"
Once again Ethan, you've forced me to learn something that I never was overly interested in. But as I follow your links I find the classification of stars very interesting. And I have more questions than your links answer. No big profound questions; just the bread and butter stuff that disciplined persistent science discovers and understands.
So I figured out the the sun is a G star.
But I realize that Planetary Nebulae, red giants and white dwarfs (i.e. from your last weeks post) aren't in the primary list. Your wiki link is a big help.
So then of course I wonder where is a link that shows the various stages and transitions in a stars life; so I get to the wikis stellar evolution link
http://en.wikipedia.org/wiki/Stellar_evolution
Of course at this point I realize that "mere" categorization of stars is serious and difficult science.
Then of course I had to think about metallicity and where that Population concept fit so another link to http://en.wikipedia.org/wiki/Metallicity
So I sort of now have a very fuzzy modest picture. Fuzzy because classification schemes even of such an apparently standard set of physical objects like stars is really difficult stuff.
And after all of this, I'm not sure if a neutron star, black hole and white dwarf are in any of these classifications schemes or are "just" considered stellar remnants. Definition matters; the definitions of the expert astronomers that is.
Of course the word "just" is such a great oversimplification.
At first glance, the classification of stars seemed simpler than the periodic table of chemical elements. Certainly there are fewer types of stars. But then there is a uniqueness about individual stars that has gotten papered over in the classifications and the evolution paths and such. I reflect upon this or that unique report about something grand learned from this individual star. The classification is of a different order than that of the periodic table.
The periodic table provides clear simple order that does not deviate. This particular isotope of this particular chemical has exactly these properties and yes it can decay by these various pathways with these probabilities.
But the clssification of the stars does not provide a clear simple order; rather it provides a scheme to get a preliminary handle on very unique and complex stellar objects whose evolution (even without considering planets) is astonishingly diverse.
So I have a renewed respect for the science activity of classification and description. It's not the glamour science; but it is the foundation that has to be understood in great detail including exceptions and all; if the glamour e.g. the nature of the universe is to be remotely credible theory.
OK that's my stream of consciousness for the moment. If I've gone to far astray or reached incorrect conclusions. Well all I can say is, you are obviously correct and I defer to you "mere" classification experts of astronomy.
Right "mere". A long time ago I invented a word (maybe others have also); that word "mereling" hasn't caught on. A "mereling" is a person like you or me or a classification astronomer; who appears to be doing something that is quite insignificant and unimportant. The image of Henry David Thoreau standing silently reflecting in a field of cabbages; and a farmer observes for a while before approaching Thoreau and saying something like, "Fine day to be doing nothing important."
I'm overtired, good night. Thanks Ethan.
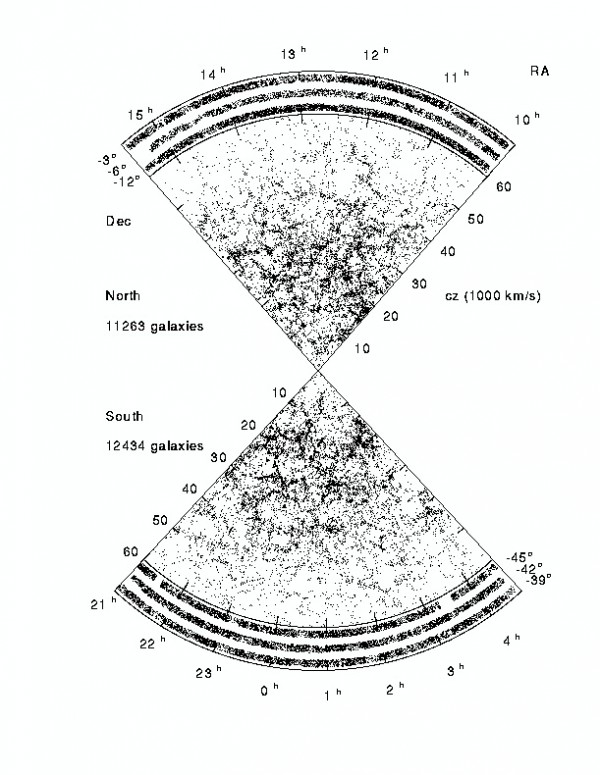
On the question of galaxy structure, and bias, is the distance and motion of the galaxies taken into consideration when these structures are drawn in (Image credit: Virgo Consortium, J.C. Jenkins et al. 1998.) , or the graphs made by(Image credit: Las Campanas Redshift Survey.) ? A galaxy a billion light years away may appear in one spot in the sky but it's had a billion years to move elsewhere, so which is drawn/graphed, where we see it's light coming from, or where it actually (or best guess) has moved to? I would imagine it would be interesting to compare both variations.
The idea of HDO (Halo Occupation Distribution) of Zheng Zheng is very interesting! Does it mean that gravitation in this model is reduced to the extension of the related halo each?
This in fact would form such honeycomb structures... This idea seems revolutionary.
about once a month i navigate this back and forth a few times ... an extraordinary rendition of the display of the universe ... and i love the comment at the largest scale ... you can't see beyond 14 billion light years because the stuff on the other side is older than time itself.
http://primaxstudio.com/stuff/scale_of_universe/
Thanks Ethan; as usual, very interesting.
The Whirlpool Galaxy though... doesn't the bottom image correlate moderately well with the top one - after rotation 90º? The kink in one arm is particularly convincing.
Joemac53 - I learned "Oh Be A Fine Girl/Guy Kiss Me (Right Now Smack)". The old classes R and N classes have been folded into class C.
OKThen - There are other classes for less common objects, for example: for planetary nebulae, Q for novae, the W series for Wolf-Rayet stars, the D series for white dwarves, and L, T, and Y for brown dwarves. These classes are based on light received directly from the objects, so I don't know of any black hole classes because those observations tend to be indirect. Neutron stars have been observed directly as pulsars, but I don't know of any classifications for them either.
As for red giants, they are generally class M or maybe K. There's a second dimension known as "Luminoisty Class". That looks at pressure indications in the light spectrum -- especially line width. This distinguishes the Main Sequence "dwarfs" from the aging giants and supergiants. Most of the class M stars you can see in the sky are red giants; the red dwarves are too dim to see with the unaided human eye.