extreme weather
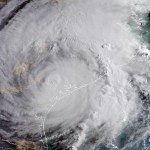
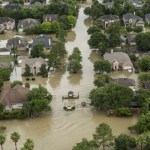
Hurricane Harvey visited a near-biblical deluge upon Houston, dropping over 40 inches of rain on parts of the city. The situation resulted from warmer ocean waters, more moisture in the atmosphere, and Houston's geography along with its preparedness for the disaster. Greg Laden shows hotter sea surface temperatures in the Tropics and the Gulf of Mexico allowed Harvey to gain extra strength as it formed and re-formed on its way to the United States. In another post, Greg asks if Houston's infrastructure could have been better-prepared for this type of rainfall, suggesting that "Houston is…
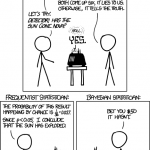
Three statisticians go hunting for rabbit. They see a rabbit. The first statistician fires and misses, her bullet striking the ground below the beast. The second statistician fires and misses, their bullet striking a branch above the lagomorph. The third statistician, a lazy frequentist, says, "We got it!"
OK, that joke was not 1/5th as funny as any of XKCD's excellent jabs at the frequentist-bayesian debate, but hopefully this will warm you up for a somewhat technical discussion on how to decide if observations about the weather are at all explainable with reference to climate change.
[…
The human release of greenhouse gasses has ultimately caused changes in weather patterns so that major storm systems in the Northern Hemisphere get wetter and move along more slowly, causing significant rainfall events to occur at a much higher rate than previously. This has become a nearly ongoing phenomenon, with major floods in Canada, Colorado, Texas, Western Europe, Texas again, various places in Azia, more in Europe, Texas again, and so on.
The short version of the story: The jet stream is often fairly linear, traveling around the planet at a high speed, but it can also get all wavy…
I recently noted that there are reasons to think that the effects of human caused climate change are coming on faster than previously expected. Since I wrote that (in late January) even more evidence has come along, so I thought it was time for an update.
First a bit of perspective. Scientists have known for a very long time that the proportion of greenhouse gasses in the Earth’s atmosphere controls (along with other factors) overall surface and upper ocean heat balance. In particular, is has been understood that the release of fossil Carbon (in coal and petroleum) as CO2 would likely warm…
Over the past three years (and indeed, for 10 of the past 14 years) California has experienced a particularly deep drought. How bad is the drought? Is it the worst in the instrumental record? The worst in over a century? The worst in 1200 years? The worst “ever”? And why has it been so bad?
There is no single definition of “drought.” Drought, most simply defined, is the mismatch between (1) the amounts of water nature provides and (2) the amounts of water that humans and the environment demand. As the National Drought Mitigation Center puts it:
“In the most general sense, drought originates…

I grew up in Calgary and a small bedroom community west of it called Bragg Creek. This event is not on a par with the flooding of a couple years ago, but it still qualifies as "freaky".
Freak Summer Snowstorm in Calgary Leaves 30,000 Without Power.
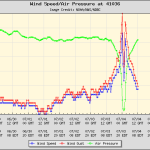
Filed under "data can be cool"
This is a graph of wind and air pressure at a weather station as a hurricane passes directly over. Notice the double spikes as each eye wall passes overhead.
I previously posted a summary of the water-related conclusions from the new National Climate Assessment, recently released after three years of writing, review, and analysis. The following “findings” are a broader summary of the results from the newly released National Climate Assessment (NCA). They are by no means a full summary: far more detail can be found in the chapters and the regional syntheses, but these are noteworthy conclusions. (Note, thanks to Tim Smith – Sustainable Water Resources Coordinator – for highlighting these. The page numbers refer to the NCA Summary)
1. Global climate…
So, the bad news is that it is looking increasingly likely that the world will experience a very strong El Nino event this 2014-2015 winter (winter in the N. hemisphere, summer down under). There is even talk of a super-El Nino, one to rival 1998's phenomenal event. Lots of good information on that here at P3. Some forecasters are now putting the odds at 70%.
Model ensemble predictions showing a coming El Nino
The repercussions for global and regional weather are very large, there will be winners and losers, though as with climate change impacts in general, the wins are…
I am a longtime fan of ThingsBreak though his/her posts are a bit of a rarity these days. The latest post is a very good one on the recent debut of Nate Silver's 538 blog. I have read a few now and "Nate Silver falls off" is the one to choose if you only only choose one.
I don't have anything to add, ThingsBreak says it all and says it well.
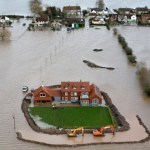
As most of you know already, England's dramatic sequence of winter storms since December has resulted in its worst winter on record. England's records go back 248 years. (Al Jazeera is reporting 300 years). Who knows if such a series of storms has ever occurred since the climate stabilized after the last glaciation ended some 8000 years ago, this is truly uncharted territory.
The featured image above serves as a very apt and stark metaphor for just what adaption to climate change means. That picture was taken at least ten days ago (I found it here where many other…
Some remarkable weather in North America recently as most of you probably know. Check out Jeff Masters for some of the details.
Record warmth and precipitation in Alaska
As of January 26, 13.83" of precipitation had fallen in Valdez during the month of January. This is more than 8" above average for this point in the month, and close to the all-time record for January precipitation of 15.18", set in 2001 (records go back to 1972.) With more rain on the way Monday and Tuesday, this record could easily fall. Numerous locations in Southeast Alaska have beaten their rainiest January day on…
[Update: it seems clear that records were broken after all as has been pointed out in the comments. So we are only left with Fox's reaction and youtube fog-pee videos. And let's face it, Fox's reaction was pretty predictable...]
The recent cold snap was indeed remarkable and the media was buzzing about it for days. But it was not remarkable for the extreme cold, which in fact set no records, it was remarkable because it has become so unusual.
Unlike the recent heat waves in the US, Australia, Russia and Europe, this cold snap did not, repeat did not set any all time monthly or daily…

Coldness can manifest where you least expect it: on a planet rapidly warmed by the combustion of fossil fuel, or in the heart of a star 250 times as massive as our own. On Greg Laden's Blog, Greg explains that an apparent "recovery" of Arctic sea ice from its historic low in 2012 does not invalidate the long-term trend. Greg also explains this year's legacy of extreme weather, such as snow in Cairo, writing that when there is less difference in temperature between equatorial and polar regions, "the jet streams get all wiggly and cause northerly air to reach far to the south in some places and…
This is just a quick post to suggest an answer to the question posed by Greg Laden here: should we have a category 6 and above for hurricanes. My answer is no.
I say this in agreement with many of the points expressed in Greg's post, mainly that category 5 basically means total destruction and for all practical purposes what is the difference between flattened like a dirt road or flattened like a paved one? But in acknowledgment of the other arguments and points of view, I would suggest further categories into the higher wind speeds in the form of Category 5A, 5B, 5C etc. It…

While reading an AP attributed article on Huffington post about Super Typhoon Haiyan (also known as Yolanda), I did a double take at this paragraph:
Weather officials said Haiyan had sustained winds of 235 kilometers per hour (147 miles per hour), with gusts of 275 kph (170 mph), when it made landfall. By those measurements, Haiyan would be comparable to a strong Category 4 hurricane in the U.S., and nearly in the top category, a 5. Hurricanes, cyclones and typhoons are the same thing. They are just called different names in different parts of the world.
It struck me because "nearly in the…
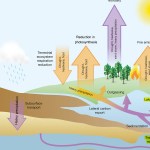
The last several decades of climate change, and climate change research, have indicated and repeatedly confirmed a rather depressing reality. When something changes in the earth's climate system, it is possible that a negative feedback will result, in which climate change is attenuated. I.e., more CO2 could cause more plant growth, the plants "eat" the CO2, so a negative feedback reduces atmospheric levels of the greenhouse gas bringing everything back to normal. Or, when something changes in the earth's climate system, we could get a positive feedback, where change in one direction (…
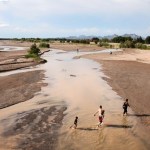
(the featured image above is of the once aptly named Rio Grande, now referred to by locals as the "Rio Sand")
The LA Times has a very chilling piece on New Mexico's not so chilling climate change. Here are a few quotes to pique your interest:
"All of New Mexico is officially in a drought, and three-quarters of it is categorized as severe or exceptional."
"The last three years have been the driest and warmest since record-keeping began here in 1895."
"With water supplies at the breaking point and no relief in sight, a domino-effect water war has broken out, which might be a harbinger of…
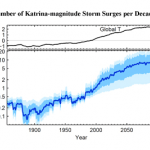
Jeff Masters reports on these studies:
Grinsted, A., J. C. Moore, and S. Jevrejeva, 2012, "A homogeneous record of Atlantic hurricane surge threat since 1923," PNAS 2012, doi:10.1073/pnas.1209542109
Grinsted, A., J. C. Moore, and S. Jevrejeva, 2012, "Projected Atlantic hurricane surge threat from rising temperatures" PNAS March 18, 2013 201209980, doi: 10.1073/pnas.1209980110
There is a press release here.
And apparently this is on top of the effects from sea level rise, of which rises measured by metres are not out of the question. I believe that a 1 cm rise in sea level…
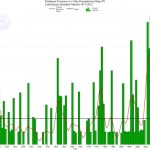
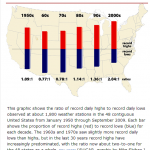
This graph shows the extremes in one-day precipitation in a given month relative to the amount of precip in that month for the Northeastern US. So, if the green bar is at 30%, that means that that 30% of month's precip fell in one event. The way this is computed is a little complicated because it is hard to define an "event" in time and space in relation to the time and space coordinates (as it were) we normally use. Check the source of the graph for a more detailed explanation. The point of this graph is that the opposite is true from what many expect: It isn't the case that the snow was…