Arctic sea ice
Based on the best available estimates, which could be better but the satellite broke, the Arctic Sea Ice is melting this year at an unprecedented rate.
It is almost like the Earth is warming up or something.
The Arctic Sea freezes over. The Arctic Sea melts. This happens every year. The average date for the maximum extent of Arctic Sea ice, based on a period of 1981-2010, is March 12. The minimum extent is reached, on average, about September 15h.
Every year for the last several years, the minimum ice has been much lower than average in extent, and many years in a row have seen record minima. This is considered to be the result of global surface warming caused by human release of greenhouse gas pollution.
It is said that we can't use the maximum ice cover to predict the minimum ice cover…
... and not in a good way.
The Arctic has, of course, been warming in step with anthropogenic global warming, plus more. This phenomenon has probably increased disruption to global weather systems, especially in the Northern Hemisphere, over the last decade or so.
But something somewhat novel is happening this year, presumably as a result of global warming combined with a strong El Nino. Storms are bringing extra warm conditions to the Arctic. A few days ago, the North Pole was above freezing, and over the next few days we are expecting more warm conditions in the Arctic Circle. See this…
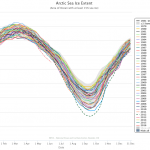
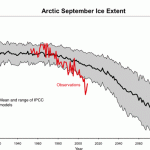
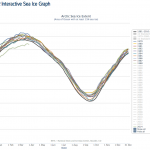
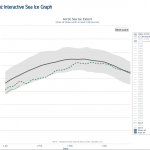
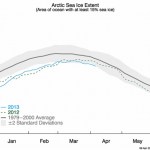
The surface ice in the Arctic has been melting to historic low levels every year for the last several years. The graph above shows the first ten years in the National Snow & Ice Data Center records, meant to indicate what Arctic Sea Ice "normally" does as it melts off during the northern warm months. The thick black line is the average over 1981-2010, and grey shaded area shows two standard deviations above and below that line. The blue line tracking along the lower end of the 2SD shaded area is the ice extent this year. During the period when sea ice is at its maximum, this year's ice…
Arctic sea ice decline happened faster than expected. This has the effect of accelerating global warming because less of the Sun's energy is reflected back into space by ice.
Northern Hemisphere snow also sends some of that energy back into space. The amount of snow cover we have is also declining.
Difference from average annual snow extent since 1971, compared to the 1966-2010 average (dashed line). Snow extents have largely been below-average since the late1980s. Graph adapted from Figure 1.1 (h) in the 2012 BAMS State of the Climate report.
The warming of the Arctic region is also…
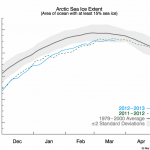
Arctic Sea Ice extent continues to be a problem. This year, according to the National Snow and Ice Data Center, ARctic Sea ice reached its lowest extent this year on September 17th, which is about the sixth lowest extent on record, following a multi-year trend of decline. There is variation from year to year. This year's minimum was almost exactly the same as last years. With the exception of 2001, minimum extent has been below the climatalogical average every year since 1998.
Dana Nuccitelli has a post on this with excellent discussion and some nice graphics, and he has also produced a…
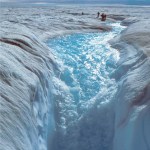
The Arctic Sea is covered with ice during the winter, and some of it melts off every summer. Over recent years the amount of melt has been increasing. This is the time of year we may want to look at Arctic Sea ice because by late September it has reached its annual minimum and is starting to reform.
Looking at JUST surface area, which is one indicator of how warm the Arctic has become with Global Warming, we can see (above) that this years march of melting has been extreme, hugging the two standard deviation limit for all of the data from 1979 to 2010 (almost the present).
Here you can…
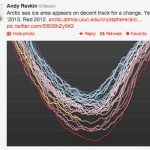
This is Andy Robinson of the Sea Ice Graphics
Put up or ... dump water on your head!
As it does every summer, the Arctic Sea ice is melting off. Over the last several years, the amount of sea ice that melts by the time it hits minimum in September has generally been increasing. So, how's it doing now?
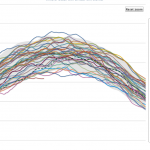
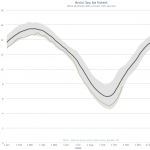
The graph above shows the 1981-2010 average plus or minus two standard deviations. Before going into more detail than that, you should look at the following graphic.
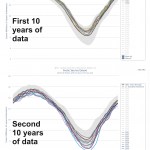
The top chart shows the march of Arctic Sea ice melt for first ten years of the baseline data set only, and the bottom chart shows the last ten years of the same data set. This tells us that the two Standard…
Earth’s northern ice cap is heating up and melting down at an alarming, not previously predicted, rate. A paper just out in Wiley Interndisciplary Reviews: Climate Change, by Josefino Comiso and Dorothy Hall looks at recent historic transformations in the Arctic using satellite imagery, mainly from 1979 to the present. The decline of Arctic ice is so extreme that ice thought to have existed for over 1450 years is melting now. (None of the sea ice is really ancient, even the “old” ice recycles over geologically short time periods. But in the near future there will be virtually no “old” ice…
I'm going to update this graph every now and then.
There are 12 lines on this graph.
The colorful squiggles up along the top are the first ten years of Arctic Sea ice extent for the period for which we have really good data. So this is 1979 - 1988. There is reason to believe that this is the "normal" sea ice extent track over the year from which we have seen significant deviation over recent decades.
The dark thick line is the average of all of the years from 1979 to 2010. Notice that the first ten years are all above the average except for a few little bits.
The partial line below all…
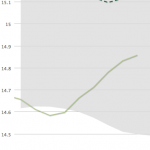
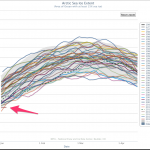
A few days ago I made a prediction for this year's minimum Arctic Sea Ice extent. That's still valid. Or not. Either way, it's still my prediction.
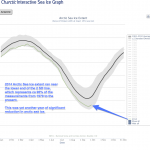
But looking at the ice over the last few days, we see that for the first time in a while the extent of ice estimated by the NSICD has stopped hugging the -2SD line and is rising upwards like a chilly Phoenix rising out of slush ashes. In fact, one could even say that Arctic Sea Ice has recovered! Just look at the last eight days of data!
Think I'm cherry picking? It's possible, let's look at the larger picture, over a whole year's cycle:…
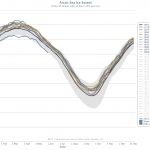
During the northern Winter, much of the Arctic is covered with sea ice. Some of this ice melts during the summer, then it regrows. Over recent years, the amount of ice loss in the summer has tended to increase, almost every year, year after year. In 2012 the loss of sea ice was extreme, falling for much of the melting and re-freezing cycle below any year seen before.
The year 2013 was also extreme, with more ice melting away in the summer than almost every previous year, but not to the extent seen in 2012.
Climate science denialist used this fact to make up a story. In this case, the word…
Andrew Revkin thinks so:
It is hard to interpret this as meaning anything other than the crisis of Arctic Sea ice melting too much and too fast is over. This is an important thing, because the rapid and widespread melting of sea ice in the Arctic seems to be causing a thing called Arctic Amplification, which means in normal human terms that the Arctic is warmer (amplified) than normal. This causes a decrease in the differential between equatorial heat and polar heat in the Northern Hemisphere which seems to change the way the Jet Streams operate which in turn causes Weather Whiplash, where…
Every northern summer Arctic Sea ice melts away and reforms for winter, but how much melts away seems to be increasing on average, at a rate that surprises climate scientists.
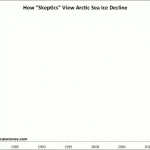
But there are some who see variation from year to year, and there is variation, in a rather unrealistic way. Here is a graph comparing how climate science denialists view arctic sea ice over time, compare to how "climate realists" (i.e., smart people who can read graphs and such) see it:
Go HERE to see the source and learn more about what is behind this graph.
Remember those puddles at the North Pole that at first everyone said were not important, then when someone realized that they were only puddles so a new meme formed and everyone said they are not important? They're important. From the abstract of a new study, just out:
The surface albedo of the Arctic sea-ice zone is a crucial component in the energy budget of the Arctic region. The treatment of sea-ice albedo has been identified as an important source of variability in the future sea-ice mass loss forecasts in coupled climate models. ... Here we present an analysis of observed changes in…
Since 2001 the amount of Arctic Sea ice that has melted during the summer has generally increased. There may have been a long term trend in melting of ice in the northern hemisphere generally, including mountain glaciers, the Greenland glaciers, and seasonally, Arctic Sea Ice. But the seasonal melting of Arctic Sea ice seems to represent a metastable shift unprecedented in available data. There is probably a tipping point followed by positive feedback. From 2001 onwards, the amount of sea ice melted each summer has gone up, and this has resulted in two related effects: 1) The total amount…
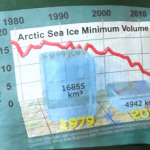
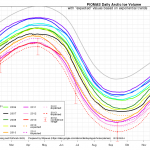
Here are a couple of great animations of the arctic sea ice volume over the satellite era.
(credit to Andy Lee Robinson, seen at Planet3)
While this is not news, I think the animations make two things very clear. One, is that anyone even giving the time of day to the notion that there is "nothing going on here, folks" when it comes to the arctic is in full-on head-in-the-sand denial or is a cynical liar. Two, is that contrary to the shrill shills who claim the IPCC et al are alarmists at best, exaggerating/misrepresenting the impacts of climate change at worst, the scientific…
Time to start watching the Arctic Sea Ice breakup. This happens every year, but as you know, the total amount of ice left each summer has been reducing, and the "old ice" which forms a basis for the arctic ice refreeze is disappearing. The result of this change in arctic ice patterns has been a shift from one form of "arctic oscillation" to another which has resulted in changes in Norther Hemisphere weather.
Here's a new video by Peter Sinclair bringing you up to date on sea ice as well as sea ice melt denialim:
The National Snow and Ice Data Center keeps track of the Arctic ice and…
It is important to get this right. There is something interesting happening in the Arctic right now, and some people are pointing to it and jumping up and down and yelling about how it is a major climate change event. But it may very well not be. Or it could be. The thing that is happening is something that normally happens, but there are features of the event that are odd. We won't know its significance until the Northern Summer, and even then we won't be sure if this is just an unusual thing for this year or a new trend because, by definition, trends run over periods of time.
Every year as…