Since DNA diagnostics companies seem to be sprouting like mushrooms after the rain, it seemed like a good time to talk about how DNA testing companies decipher meaning from the tests they perform.
Last week, I wrote about interpreting DNA sequence traces and the kind of work that a data analyst or bioinformatics technician does in a DNA diagnostics company. As you might imagine, looking at every single DNA sample by eye gets rather tiring. One of the things that informatics companies (like ours) do, is to try and help people analyze several samples at once so that they can scan fewer individual samples.
You might be wondering how we do that.
One of the things we do is to give people tools that let them scan several samples at once.
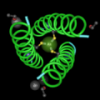
The examples below show quality plots for reads. Every quality value for every base in a read is plotted on the y axis and the position within the sequence, on the x axis.

Question: Which read(s):
- 1. contains either a SNP (a single nucleotide polymorphism) or a position where different members of a multi-gene family have a different base?
- 2. doesn't have any DNA?
- 3. is a PCR product?
More than one answer might be correct.
Hi Sandra,
Good article!
I'll take a stab at your questions...
1. C, the drastic drop in quality at ~300 is a likely mixed base. There could of course be others elsewhere if there is a big gene family.
2. B, bad or mixed templates
3. A or B could be PC products....
Now I have a question!
Do you have any experience with the accuracy of re-calling services like that from Nucleics (no link since I don't want to sound like an ad)? I've seen their service increase "called" bases to >1000...but they don't really have any data showing accuracy of their trace re-interpretation algorithm.
Best,
Eric
I'll agree with Eric, cept that A and C look like PCR products to me, due to the rise and drop in quality values at around 100 and 550 bases.
Eric and Rick: I'll put my answers up tomorrow.
BTW - I have heard of Nucleics but I don't have any experience with using their product.
I do have a bit of experience with phred and KB and I did do a bit of investigating (here and here) to see what happens when you use phred to base call chromatograms after they've been processed with KB.
A and C both look like PCR products to me, because the quality is low for the first 50 or 100 bases, then excellent until 550 or so, and then dropping off. That pretty much describes most of the BigDye sequencing that I do, depending on the size of the amplicon and the phase of the moon.
The big drop in the middle of a high-quality region (seen in C) would make sense if there's a short polymorphism of some kind, because there'd be two (or more) overlapping peaks instead of one single sharp one.
The low quality of B could result from a failure (e.g. no DNA). If it's only a measure of quality rather than quantity, I'd also expect something like this if there was DNA in the produce but something (template contamination, wrong PCR conditions, etc.) had messed up the specificity of the primer-template binding.
If I get this kind of data send to me and not the real print out from a seqeuncing run, say from a 3700 or 3730 trace, than I would spent a penny on this type of service.
I'm not sure what you mean Klaus.
We use these kinds of graphs because they allow us to scan the quality of several traces, at once, rather than viewing them one at a time.
This information tells us which individual traces are going to be useful and potentially interesting. We do look at traces, too. Each of quality values that you see in these graphs comes from a scanning a trace and corresponds to an base in the read. You can see how the quality values correspond to peaks in the trace here.
Hi Sandy,
If you drill down on the 23andme and Navigenics sites, you discover they are using the Illumina HumanHap550+ BeadChip the Affy whole-genome screening chip, not sequencing. Shouldn't the discussion therefore be about the ability of these technology platforms to delivery reliable genetic information vs. quality in DNA sequencing.
Kevin
Well, yes, the companies aren't doing actual sequencing, but rather SNP scans. Still, the quality of the input DNA should be available to the consumer/testee.
Kevin & MrGunn:
You're both correct. The new personal genomics companies (23andme, Navigenics, and deCode) are using less direct methods for identifying SNPs than DNA sequencing.
But, there are many companies and laboratories that use DNA sequencing as a diagnostic tool. DNA sequencing is still the gold standard in diagnostics and SNP discovery and will remain so for a long time.
In fact, as the cost of DNA sequencing goes down, I expect it will become even more of a standard since it gives you the ability to directly interrogate the sample.
I expect that the personal genomics companies will simply use whatever technology is cheapest. Since they're not regulated by the FDA, I don't think they'll be held to as high a standard.
QA/QC is still an issue with high-resolution SNP genotyping, particularly (at the moment) as regards the Affymetrix products, which require a lot of attention to filtering out unreliable genotype calls. The NIH GAIN program (large-scale genome wide association studies of complex diseases) has had very deep discussions about this, see for example http://www.fnih.org/GAIN2/Workshop_II_2007.shtml It is arguably less of an issue with the Illumina Infinium products, in large part due to the nature of the assay itself, but it's still an issue - both Illumina and Affy genotyping systems produce a kind of quality or confidence score for genotypes, and determining what lower cutoff to use depends on a variety of factors, some of which can be rather subjective. It's something we agonize over here at CIDR where high-throughput genotyping for complex disease studies is what we do for a living, and turning out the highest-quality data is what we've made our reputation on over the last 10 years. In any case, it is naive to assume that you just take some DNA and put it into one end of the [Illumina, Affymetrix] black-box genoptying system and get *the* genotype out the other end. There are many sources of variability, e.g., the DNA source (derived from whole blood is typically good, followed by buccal swabs, buffy coat (plasma fraction), cell lines, blood spots and so forth in no particular order), the priors or standard used in determining genotype cluster boundries (for Affy 5.0/6.0 a typical current practice is to be to call each plate of samples together, whereas for Illumina Infinium a typical practice is to use HapMap reference samples initially and then as more samples in a given project are genotyped to use those to create a more well-suited cluster definition file - particularly when the samples are from a specific local population... if there are several then you may have to generate separate cluster definition files for each population), the specific instrument on which the slide was scanned (no two are exactly alike and thus the exact same slide can give different results due to different focus, intensity settings etc.), the normalization procedure and the particular algorithm employed (e.g., we encountered a case where the method expected a particular distribution of homo- and heterozygote calls but since we were genotyping mouse crosses that didn't obey these assumptions the genotyping was problematic), the judgement of the specialists who review marginal calls, and many many more. Which makes it all the more amazing (and reassuring) that when variability is rigorously held to a minimum and unreliable data excluded, concordance between genotypes on the same samples, but produced at different times and/or on different products and/or labs, usually is extremely high. At a low level SNP array genotyping IS similar to sequencing because the actual raw data is optoelectronic in nature - an image of a probe is captured, the boundries determined and then various values computed from that image, typically averaged over redundant probes and then normalized - this is the raw data that should be preserved in anticipation of improved future methods, not just the AA/AB/BBs ultimately derived from this data!